GeneBridge tutorial
Modules described here are gene sets/pathways obtained from KEGG, Reactome, and GO (Gene ontology). All modules, including the redundant modules (modules with similar gene components), as well as parent-child modules, were considered as independent in the analysis.
G-MAD - Modules by Gene
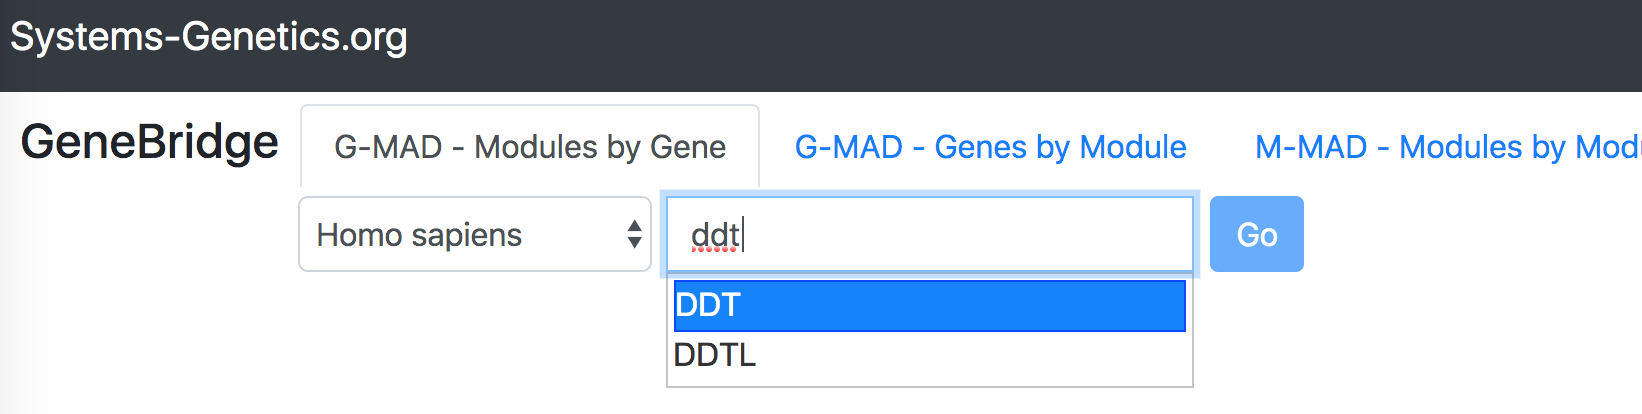
"G-MAD - Modules by Gene" identifies the associated modules (gene sets) for a given gene.To perform the analysis, select "GeneBridge" under the "Explore" option. Go to the "G-MAD - Modules by Gene" tab, and then select the species you want to use (out of 6 species). Enter the gene symbol in the "Gene name" box, then select the correct gene from the dropdown list and click "Go" button to start the analysis.
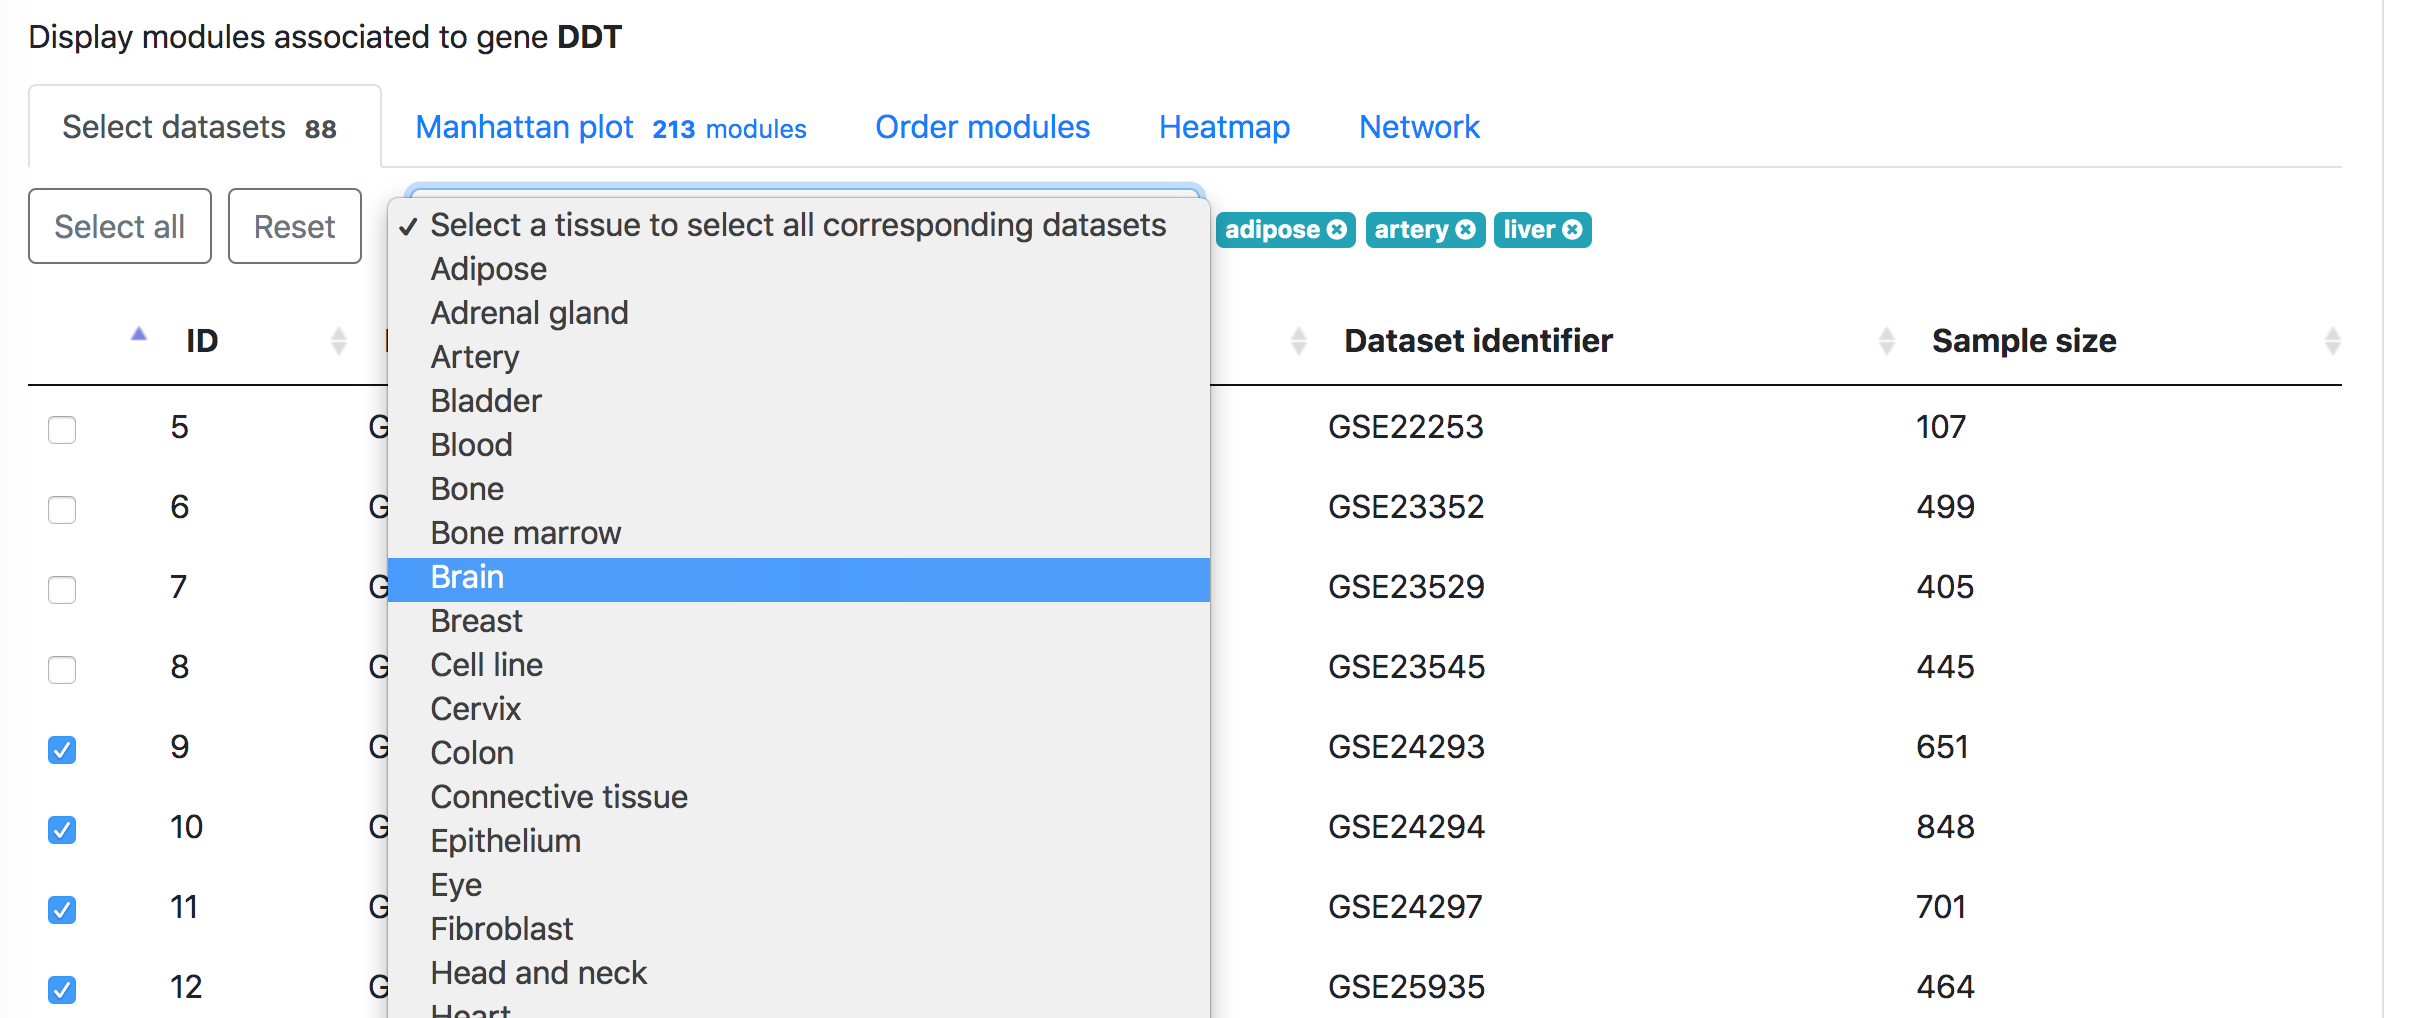
In the "Select datasets" tab appearing below, one can select the datasets used for the analysis based on the tissues of interest or simply skip this step to use all datasets. Selected tissues will appear to the right of the selection box. One can click "X" to delete one selected tissue or click "Reset" button to delete all selected tissues. The number in the tab name next to "Select datasets" indicates the number of selected datasets.
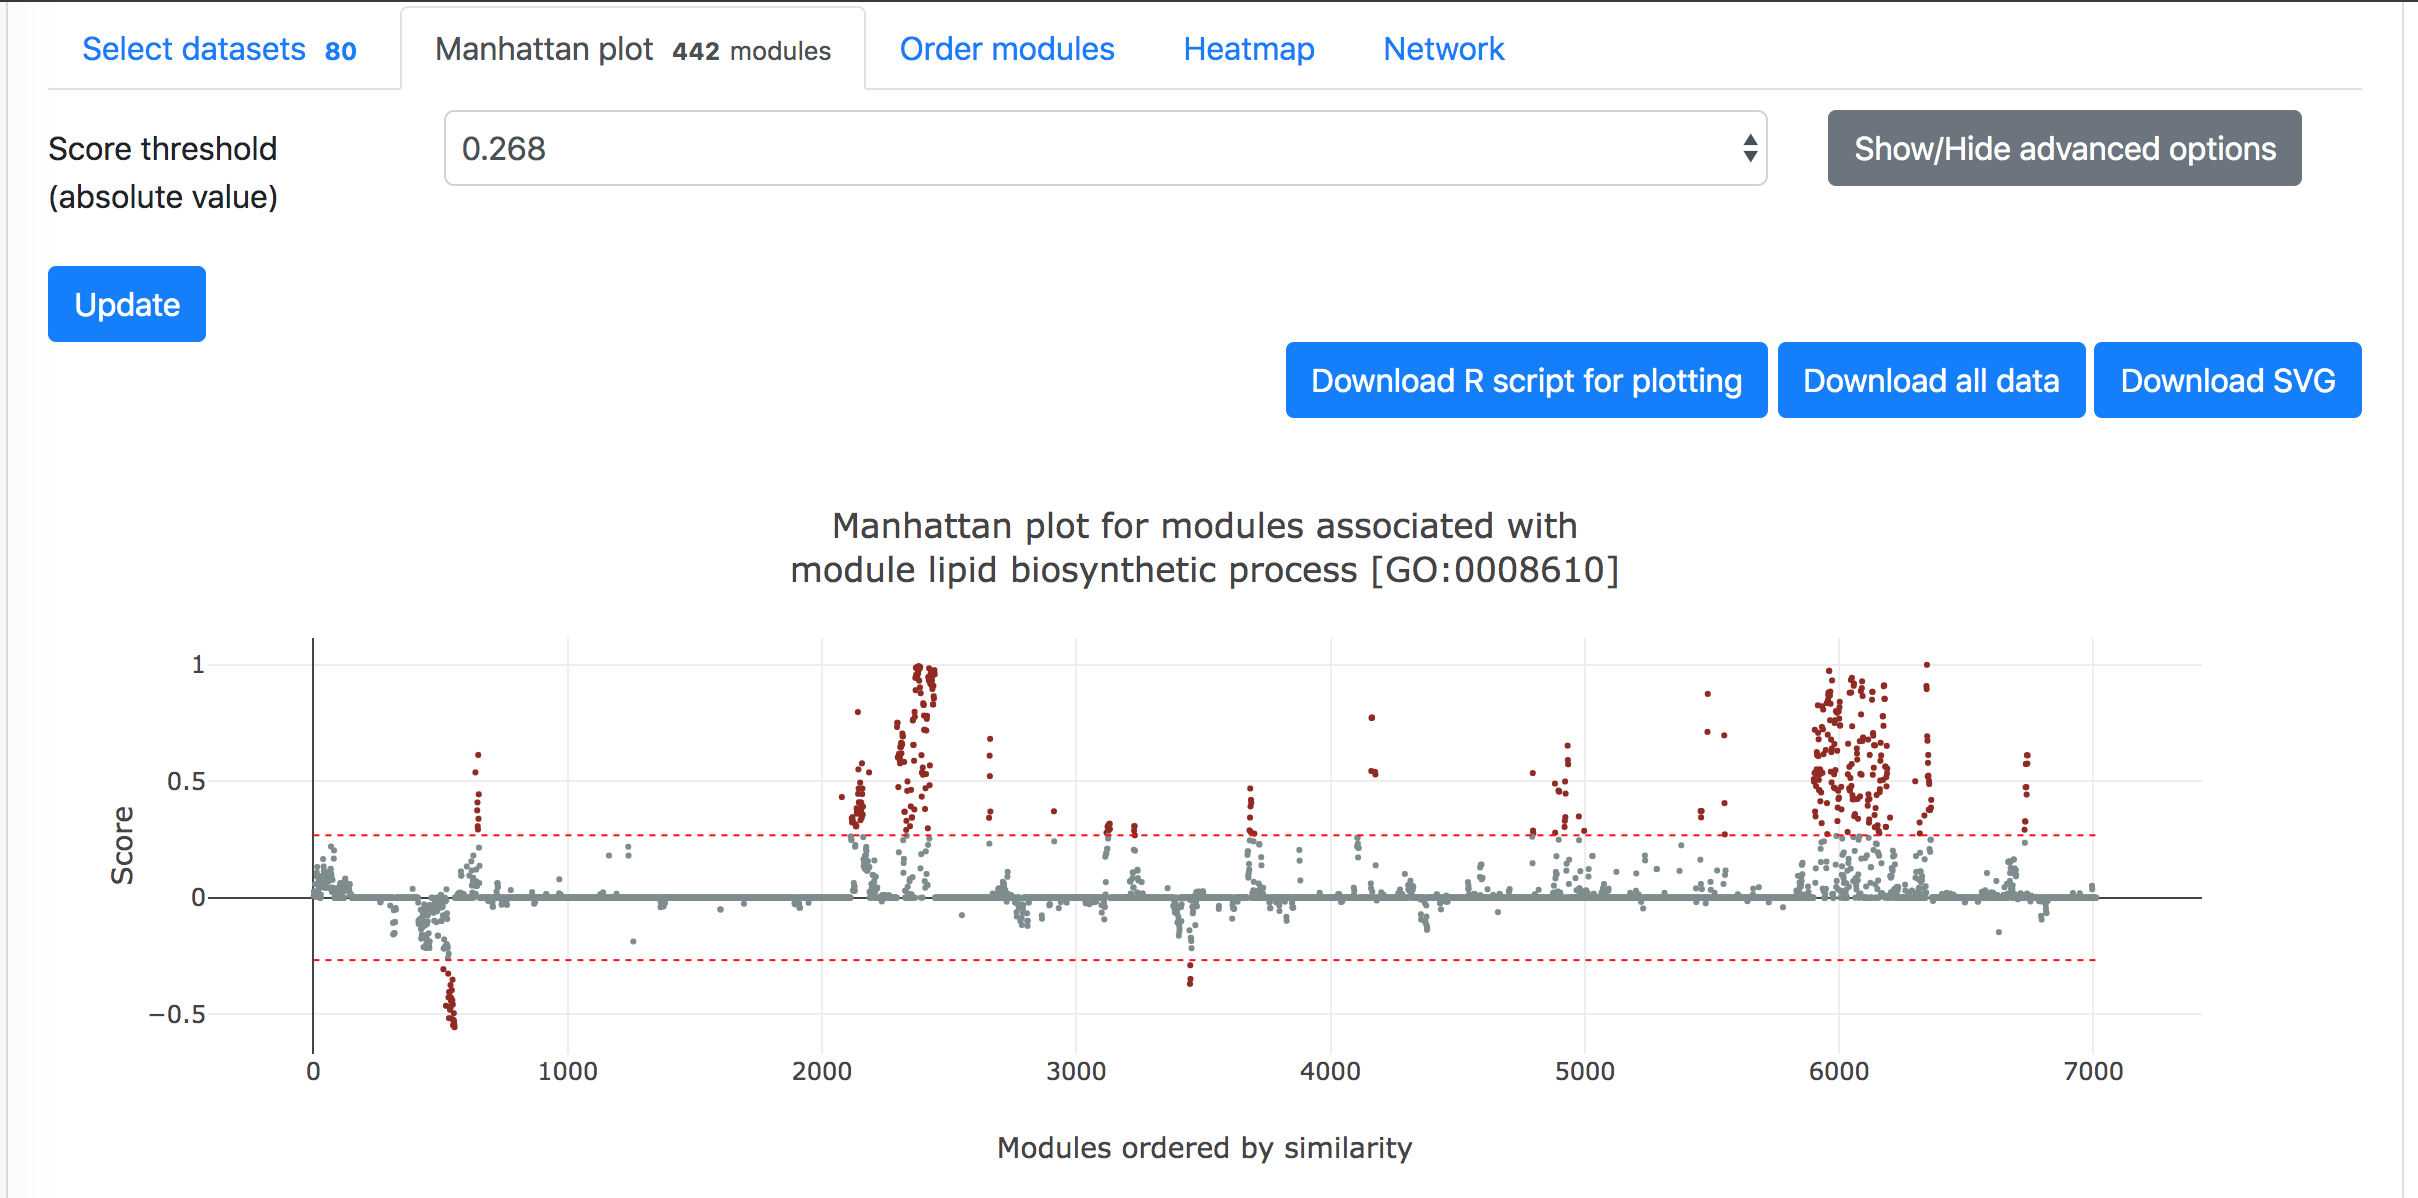
Then in the "Manhattan plot" tab, you can get the Manhattan plot for the analysis using the target gene and selected datasets. The y-axis indicates the association scores between the modules and the target gene, while the modules are arranged based on their similarities in gene compositions in the x-axis. Hove over the dots to see the details of the modules (ID, description, and association score). One can download the data and R code to reproduce the plot in local computer or download the exist figure in the svg format.
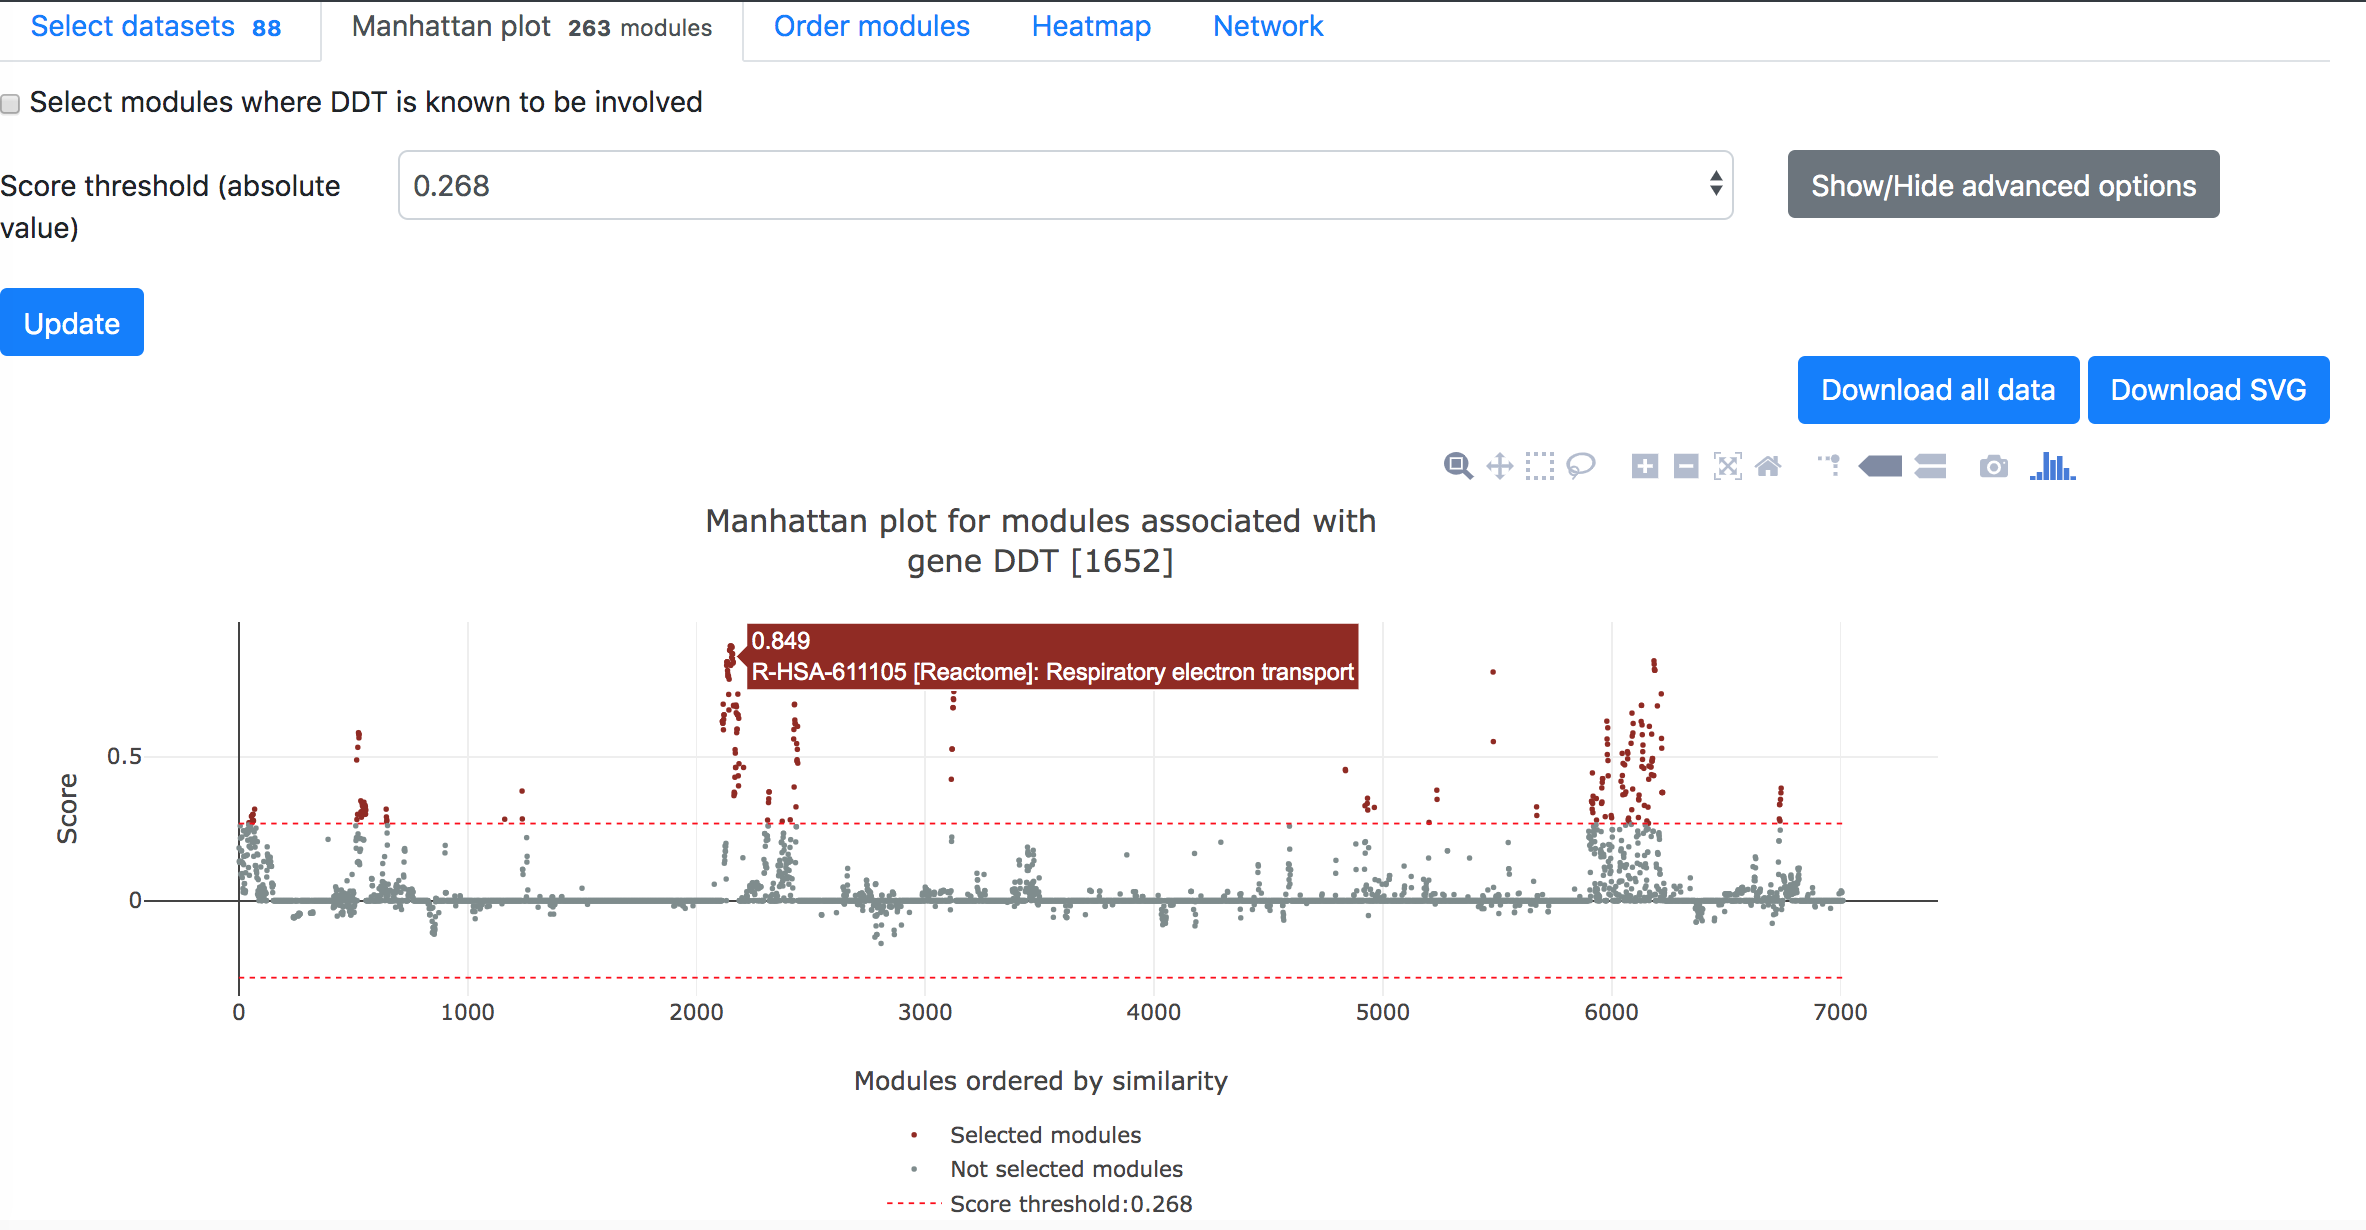
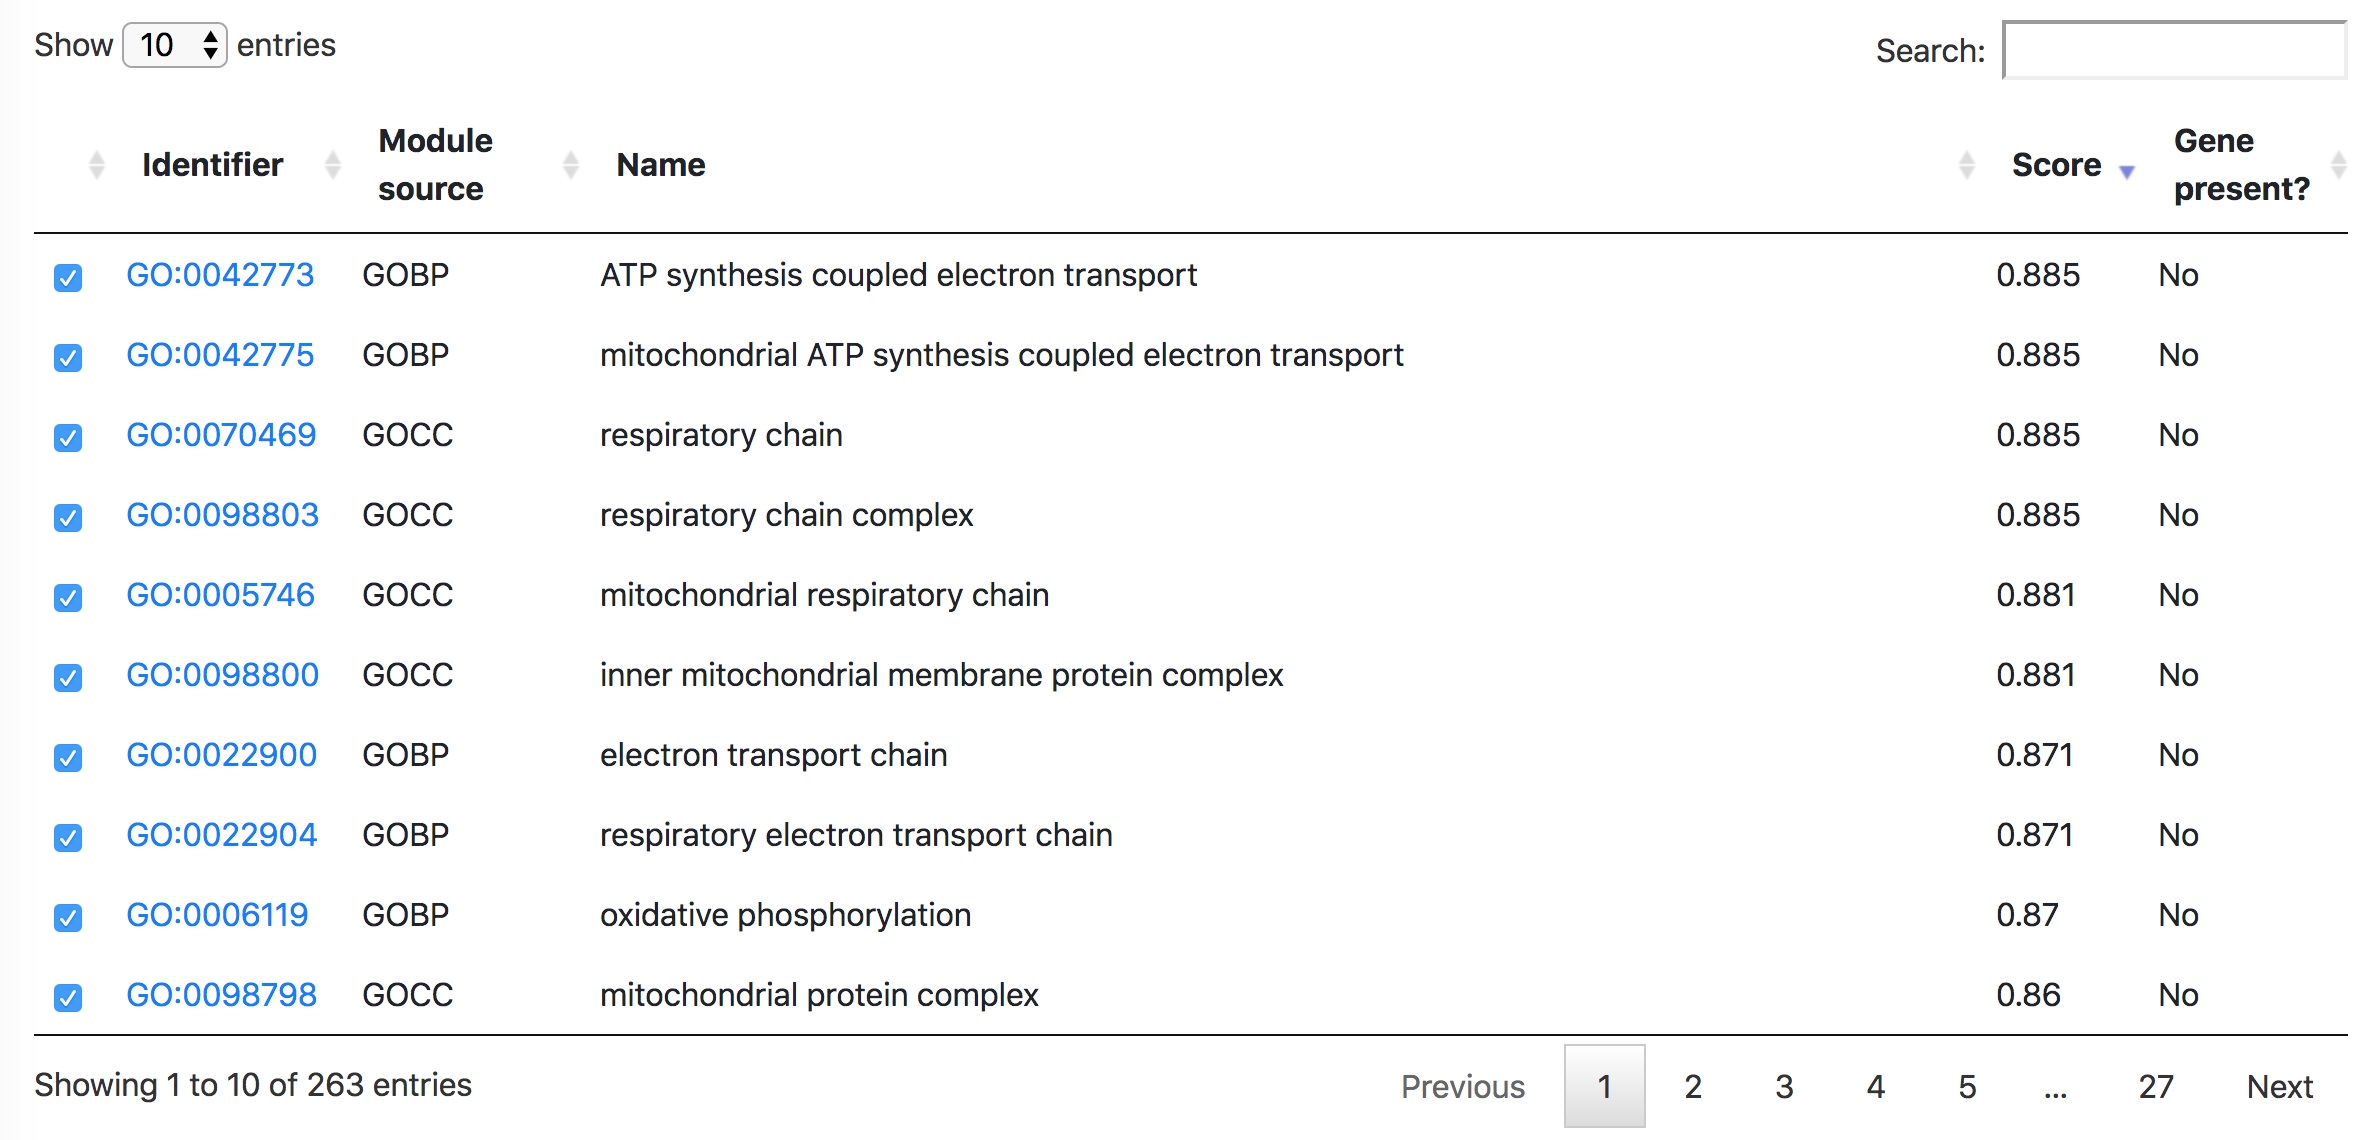
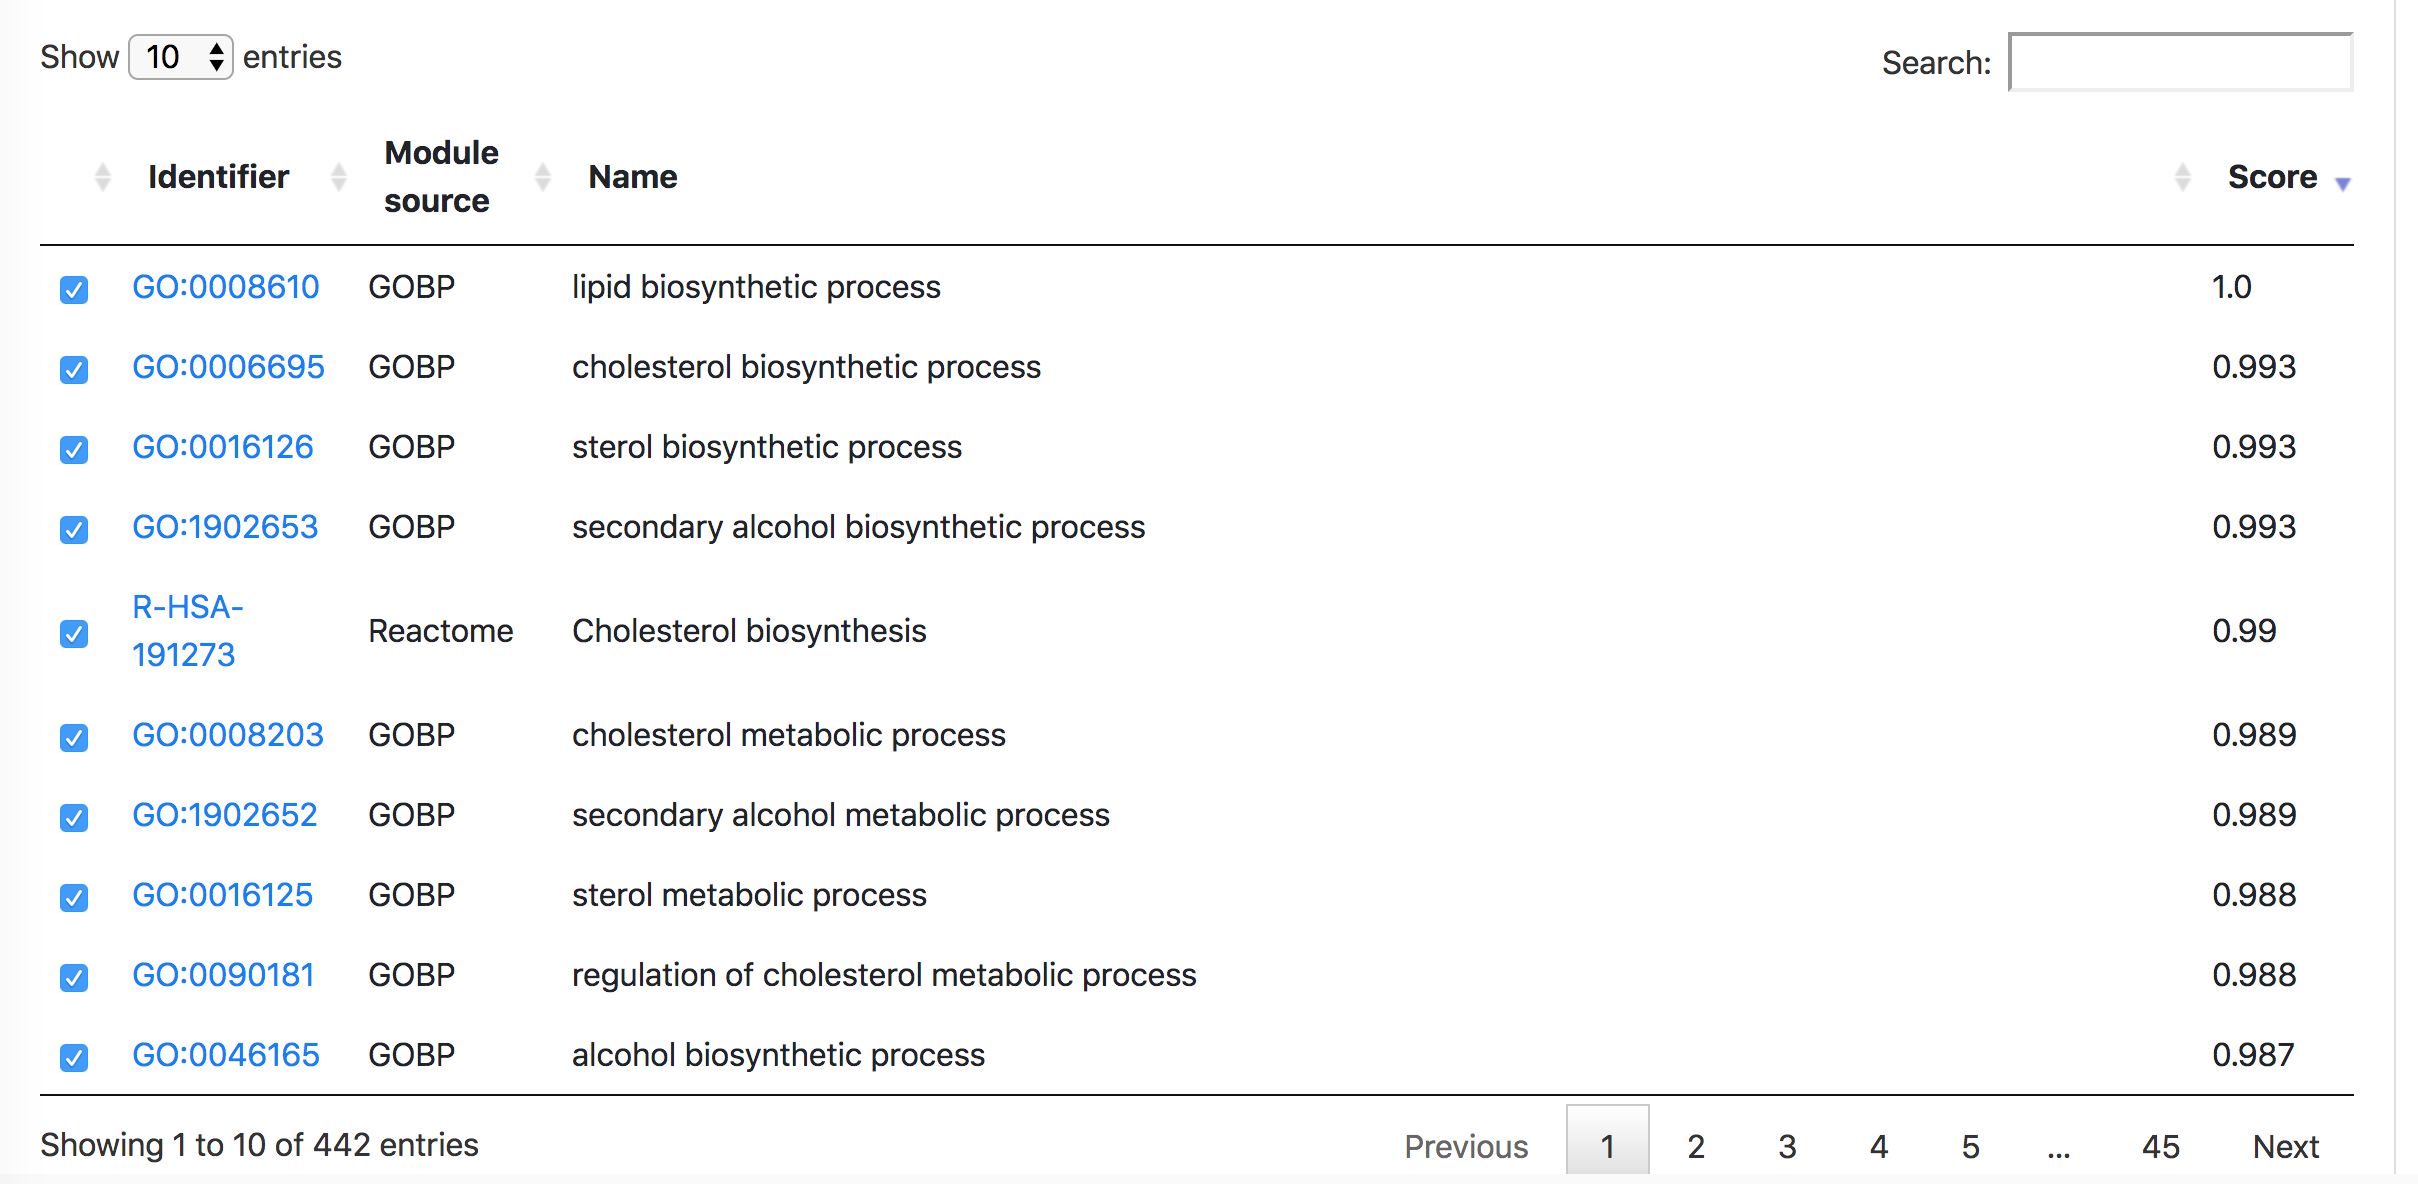
Below the Manhattan plot is a table listing the list of modules with association score exceeding the threshold.
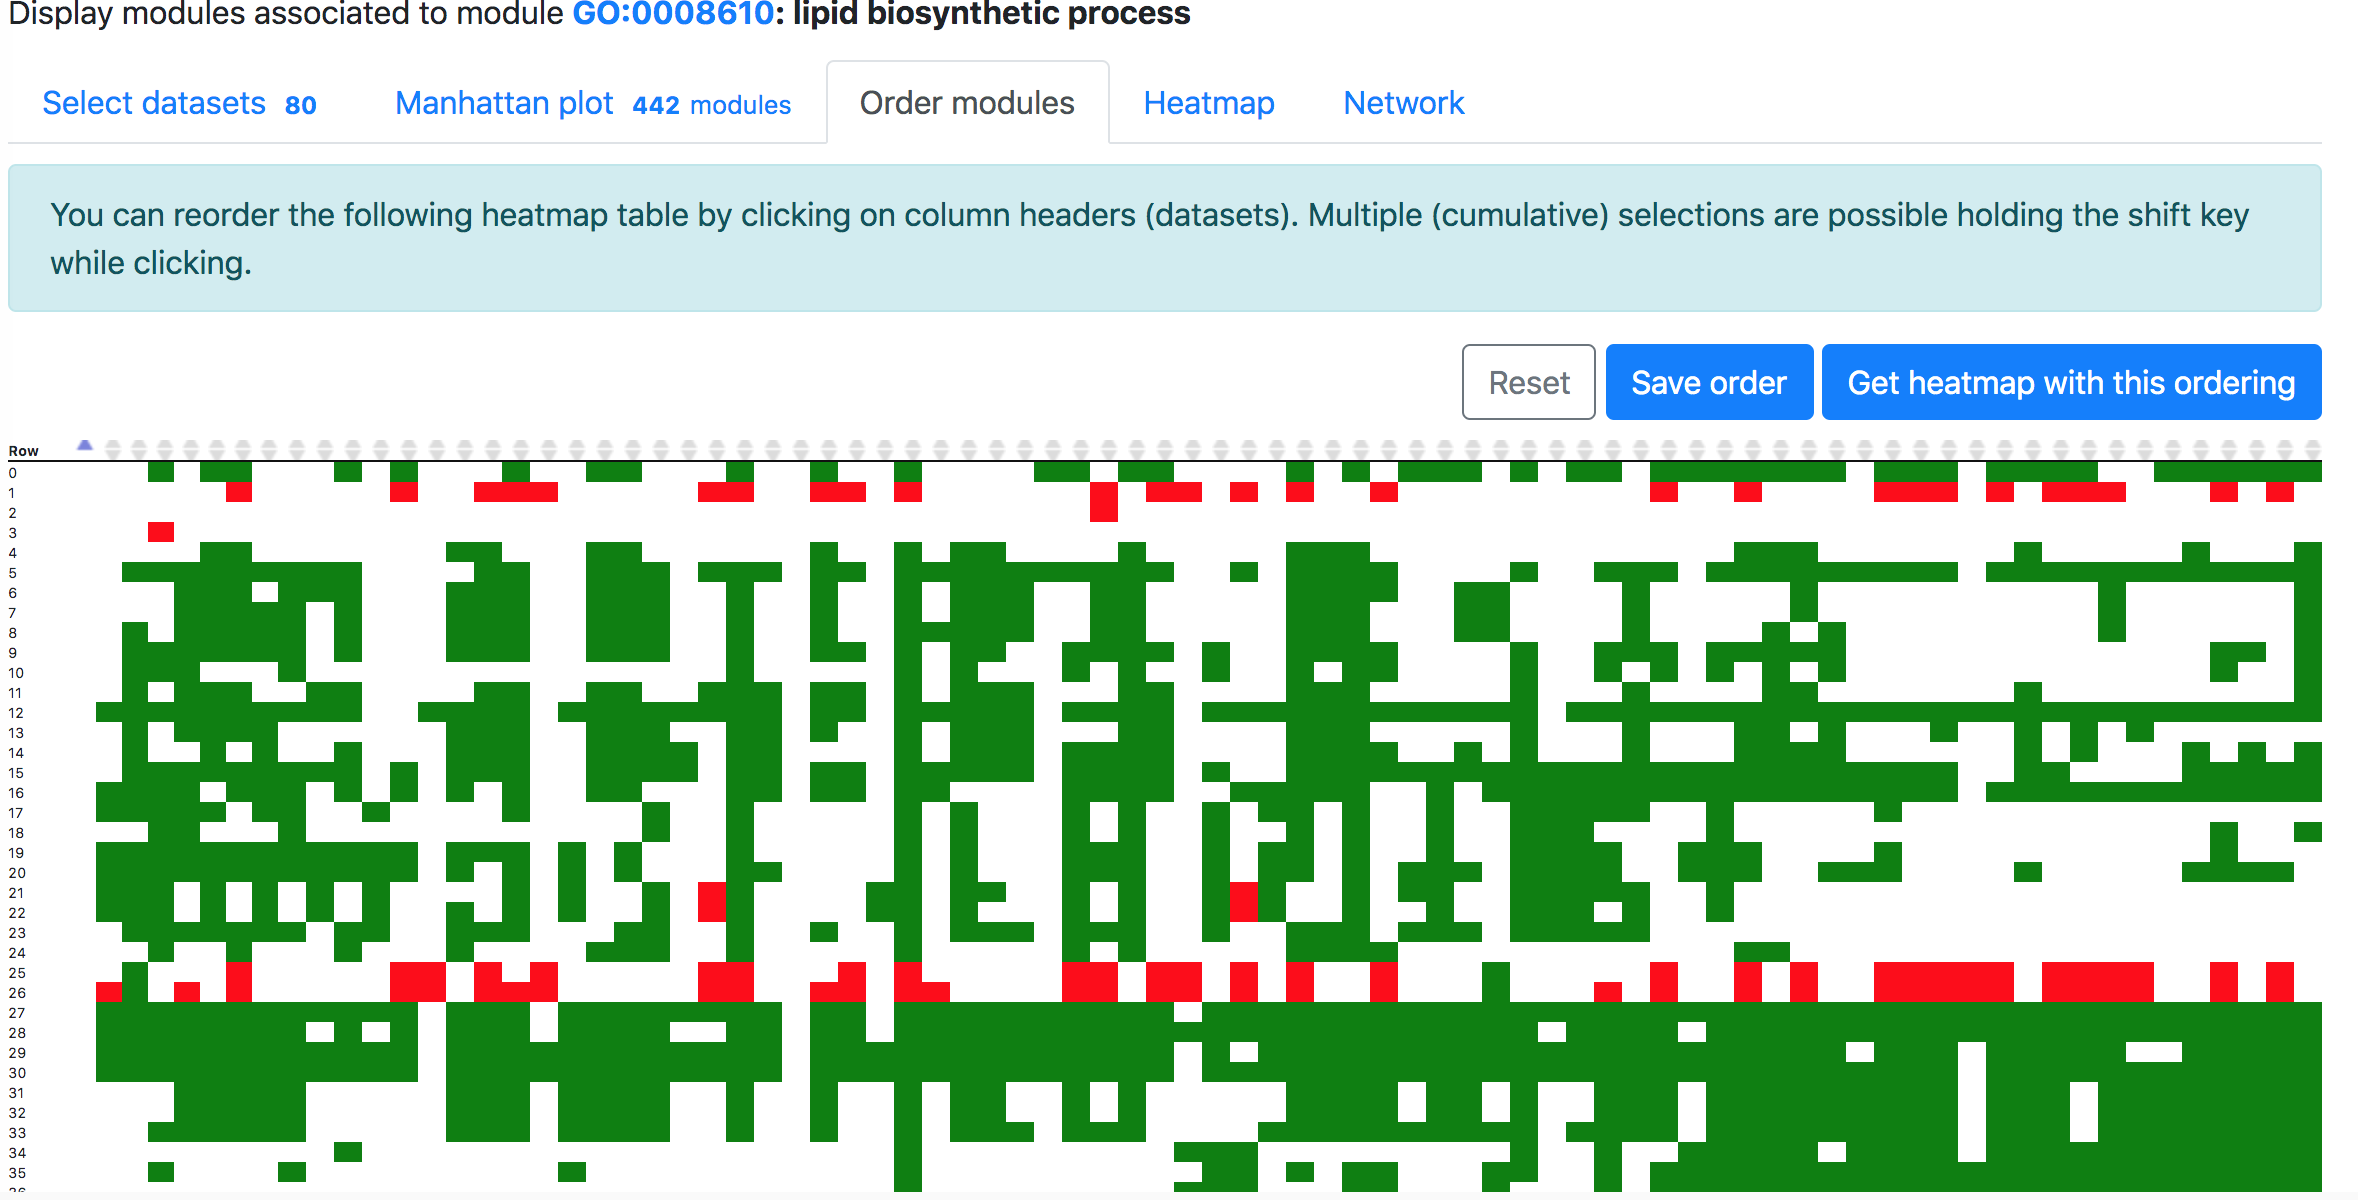
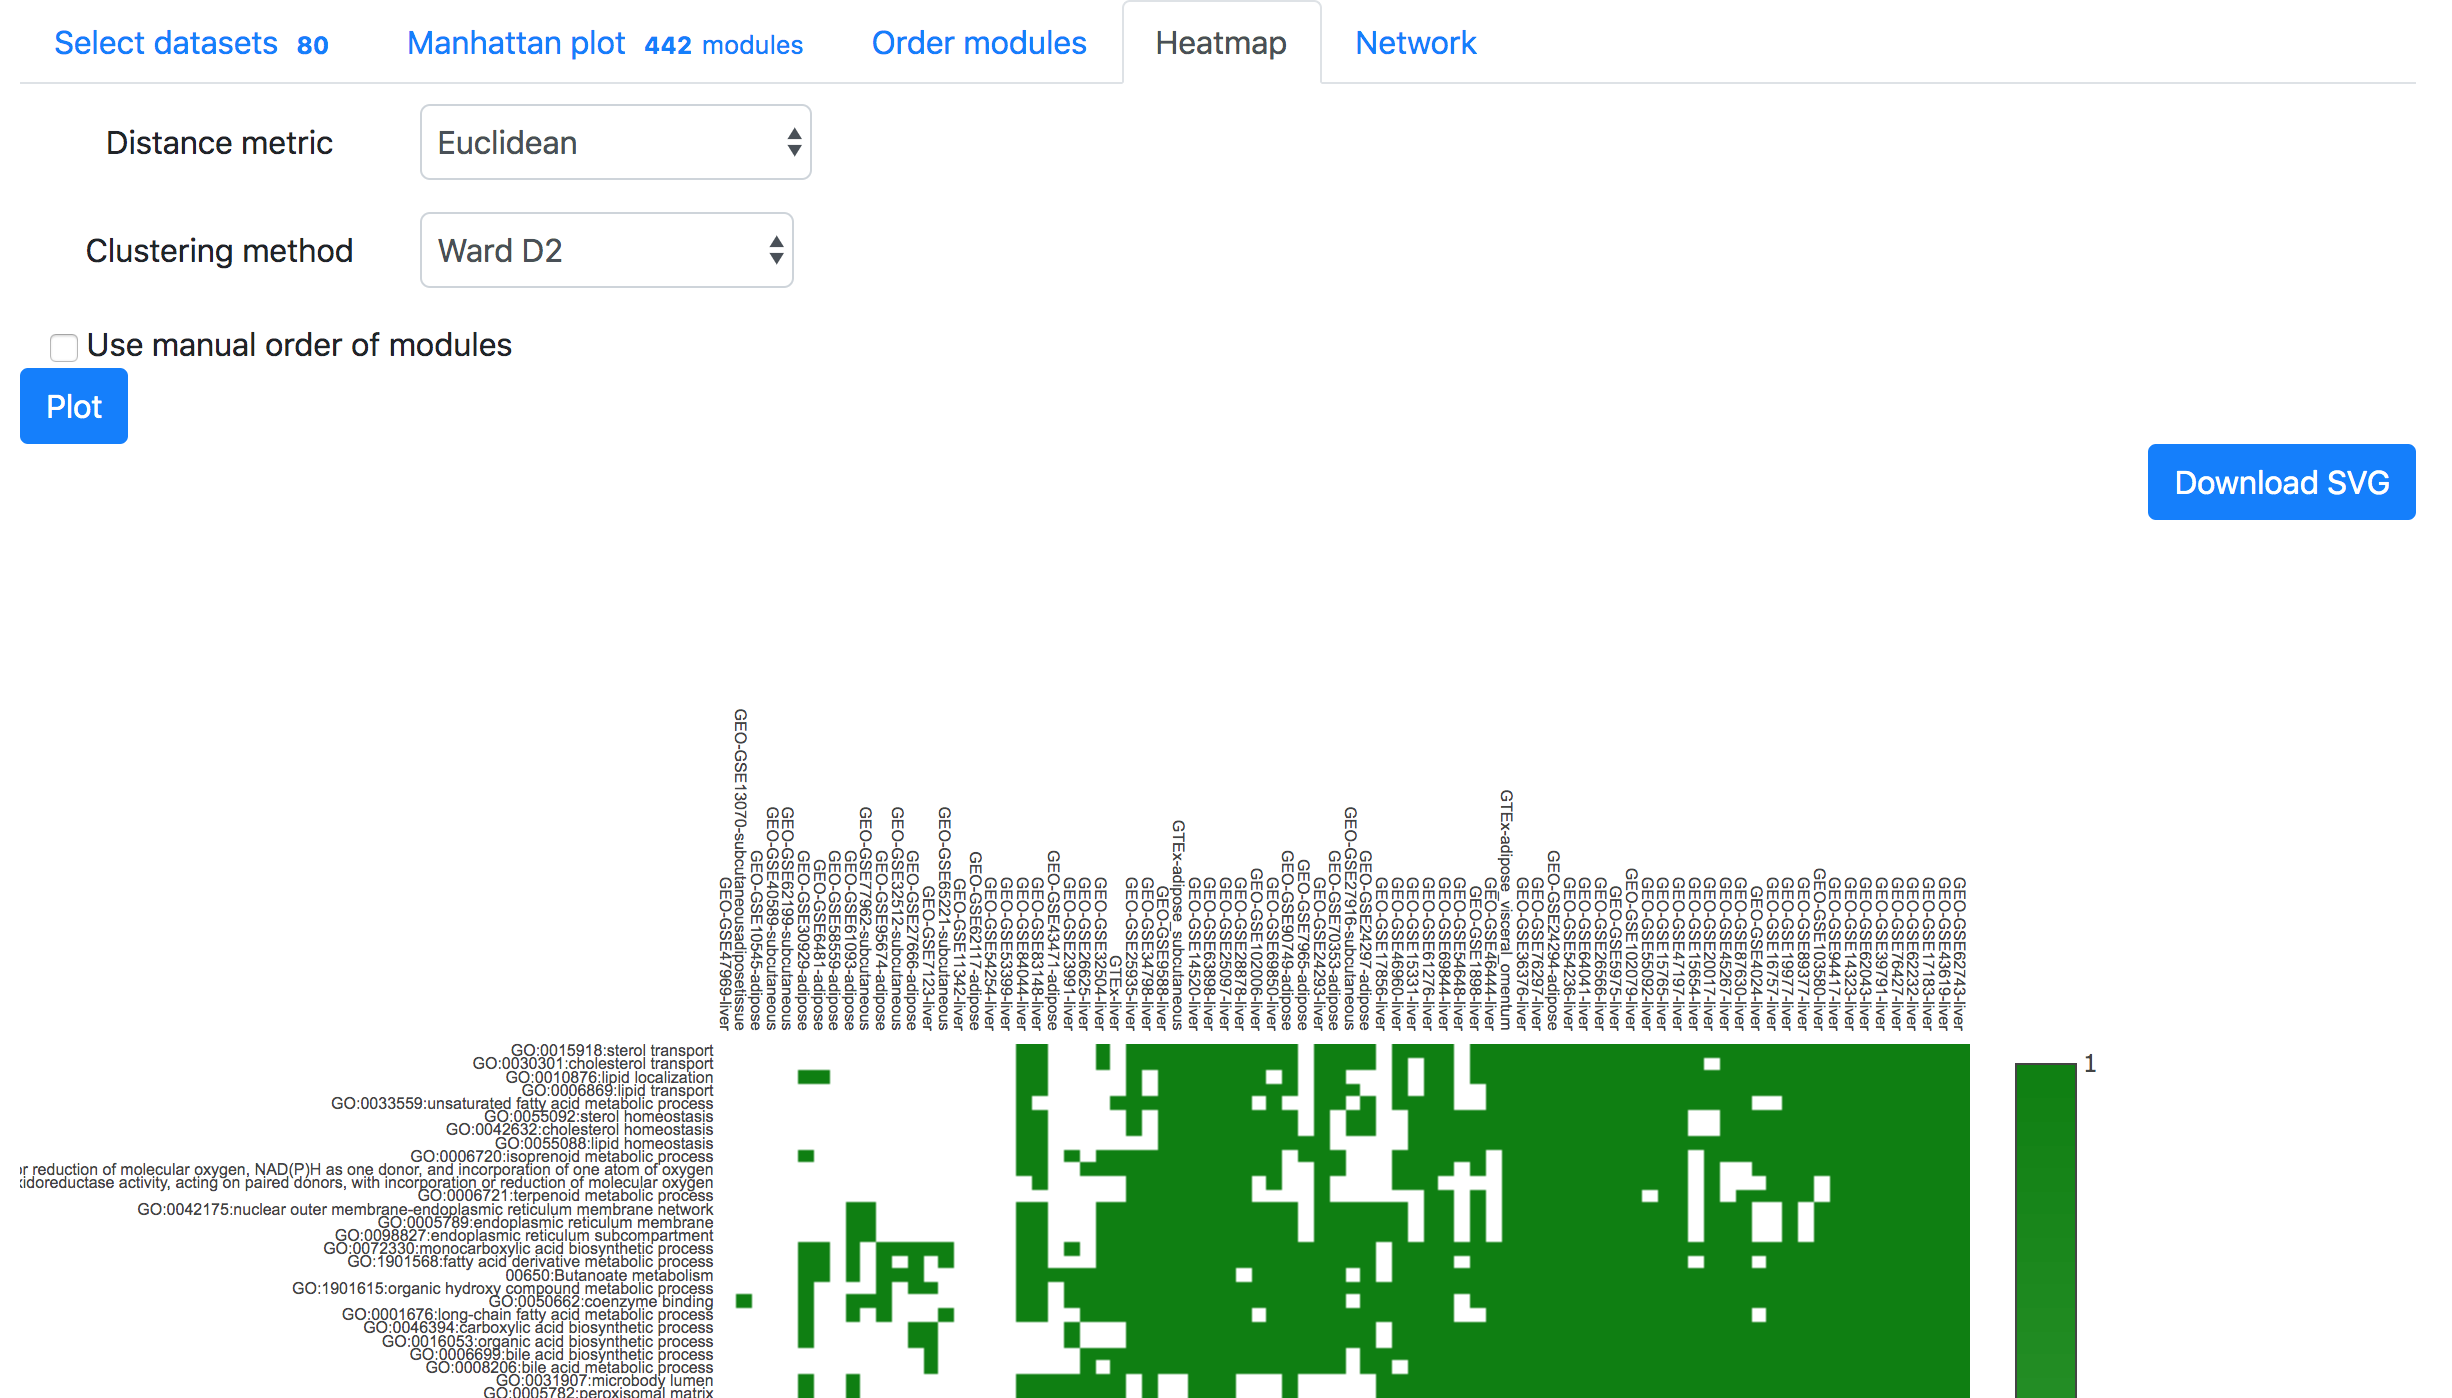
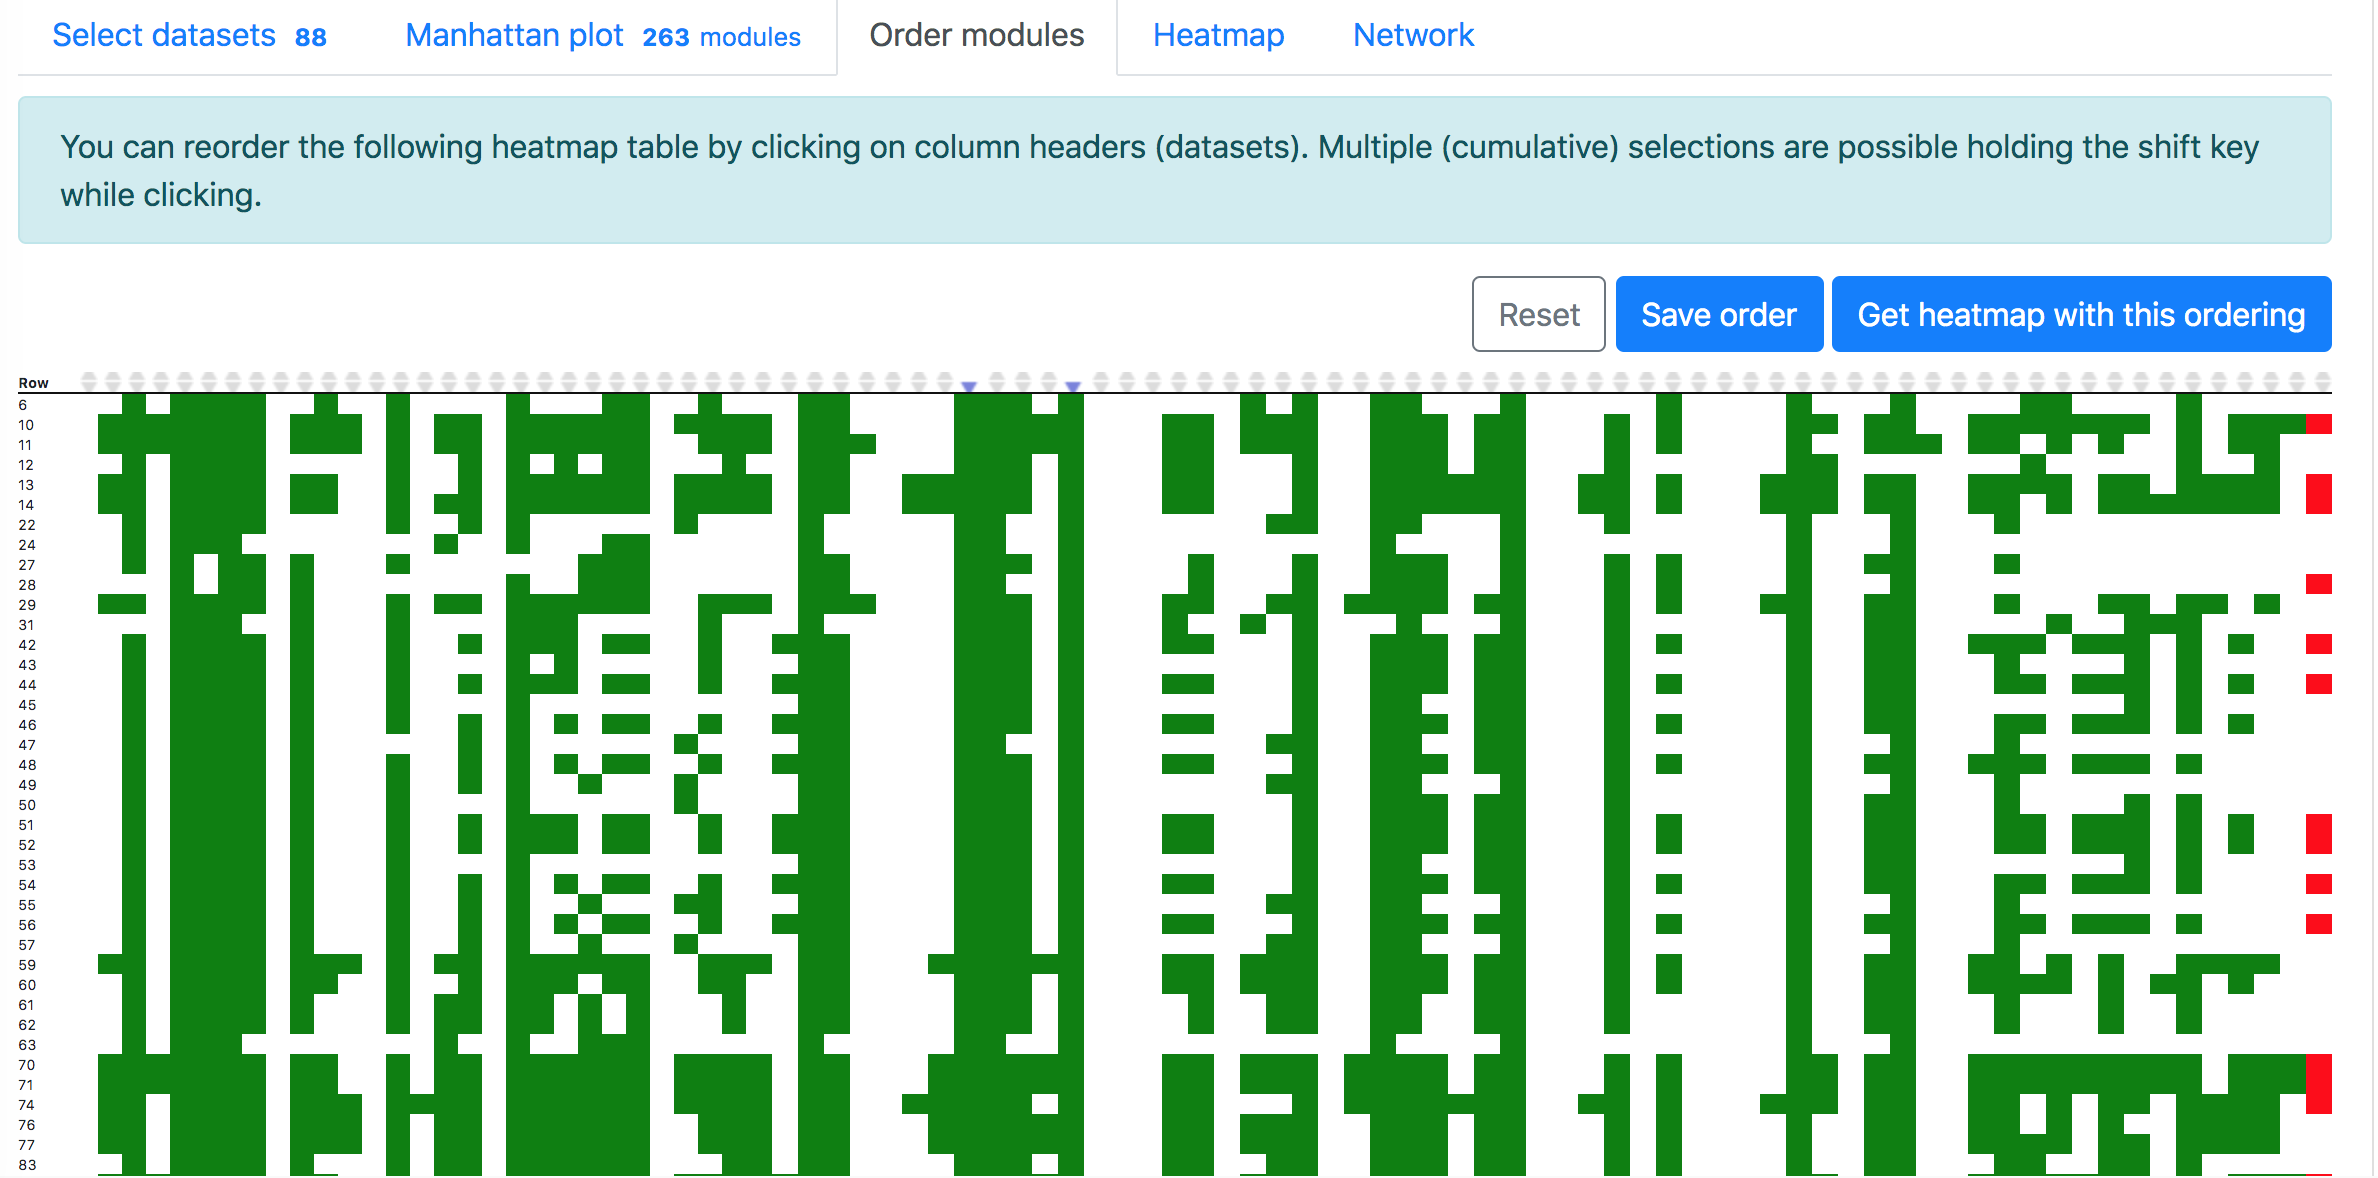
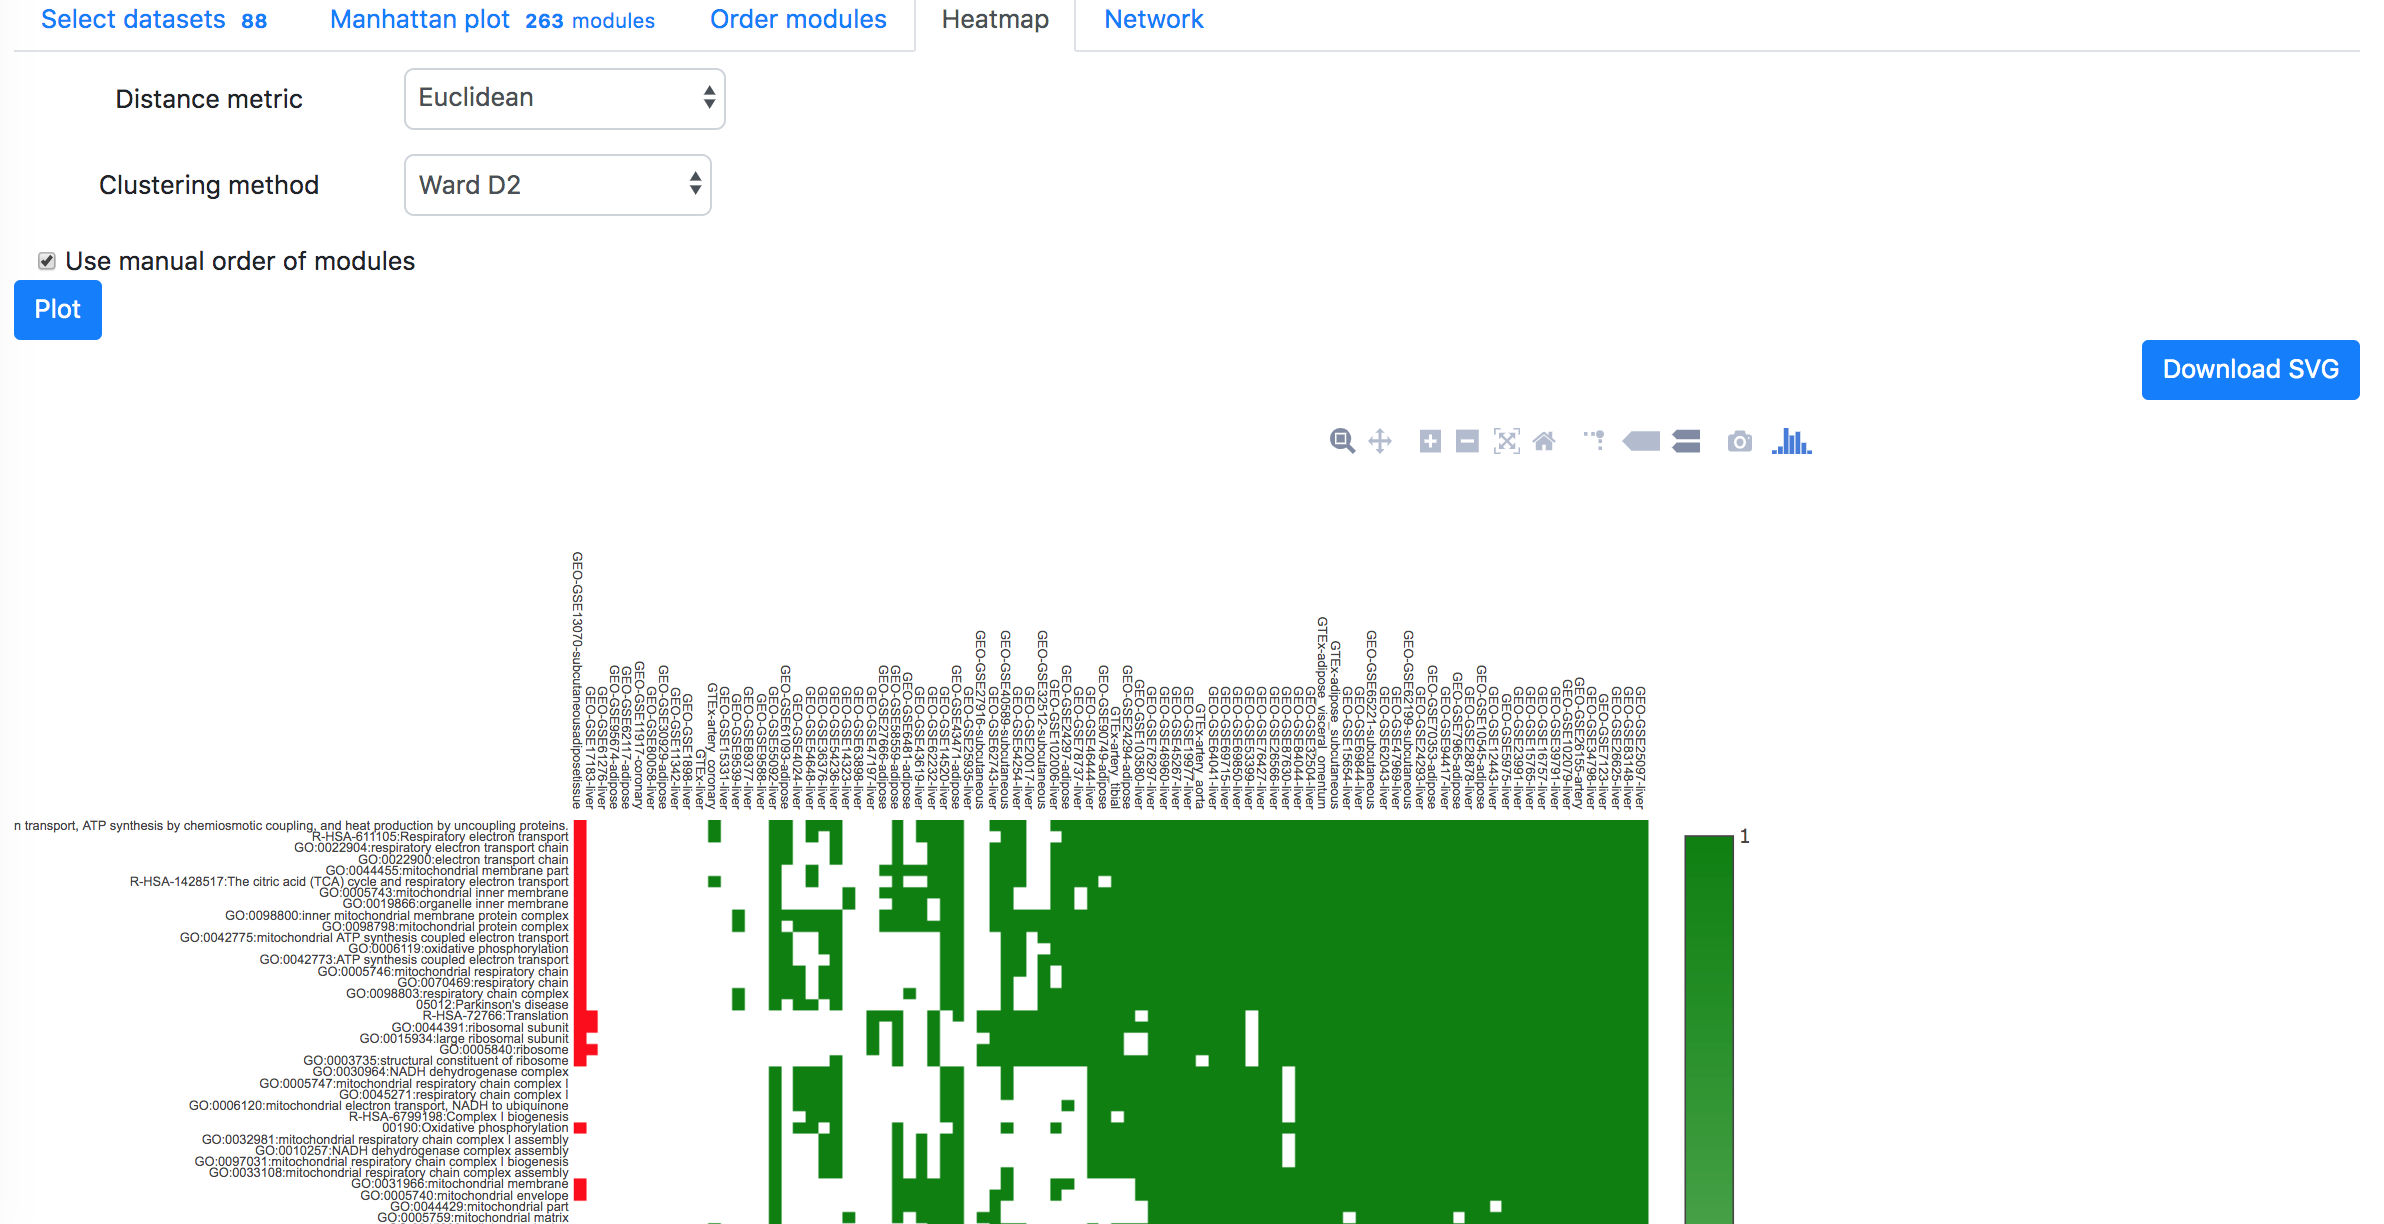
In the "Order modules" and "Heatmap" tabs, one can create a heatmap showing the results from all the selected datasets and modules. Please restrict the number of datasets and modules to less than 300, otherwise "Order modules" will not be possible but you can download the heatmap from the "Heatmap" tab.
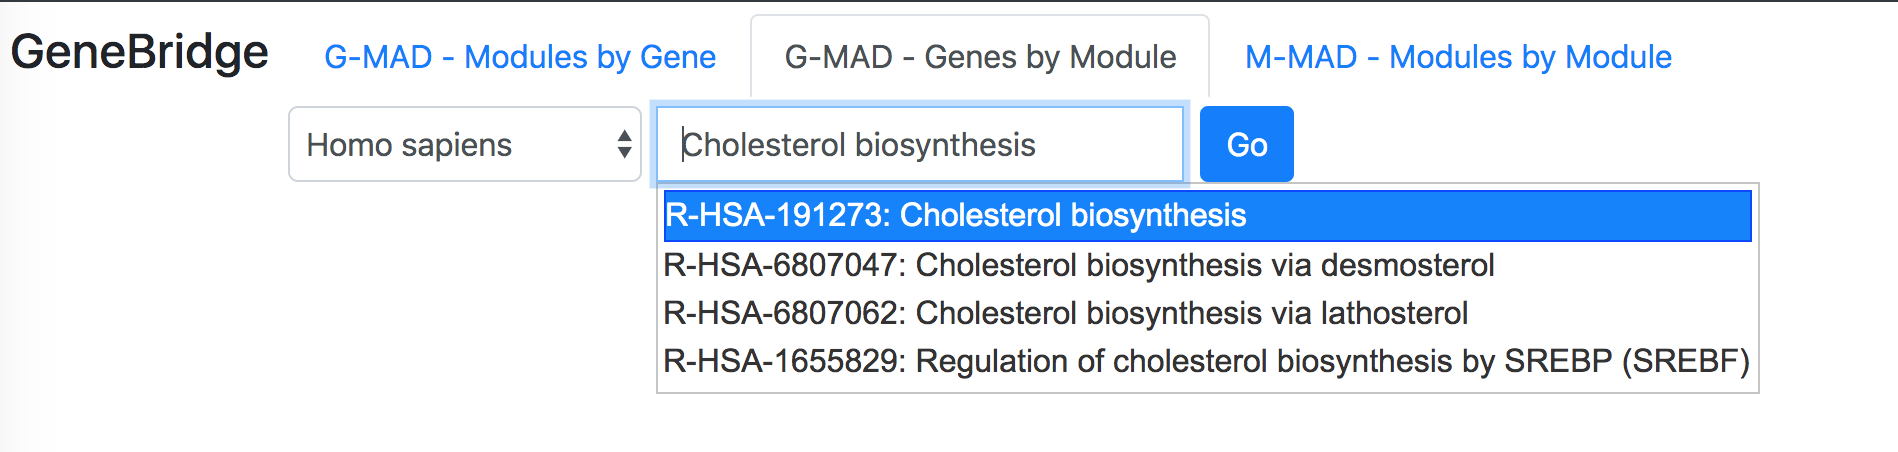
G-MAD - Genes by Module
"G-MAD - Genes by Module" identifies the associated genes for a given module.To perform the analysis, select "GeneBridge" under the "Explore" option. Go to the "G-MAD - Genes by Module" tab, and then select the species you want to use (out of 6 species). Enter the module name or ID in the "Module name or identifier" box, then select the correct module from the dropdown list and click "Go" button to start the analysis.
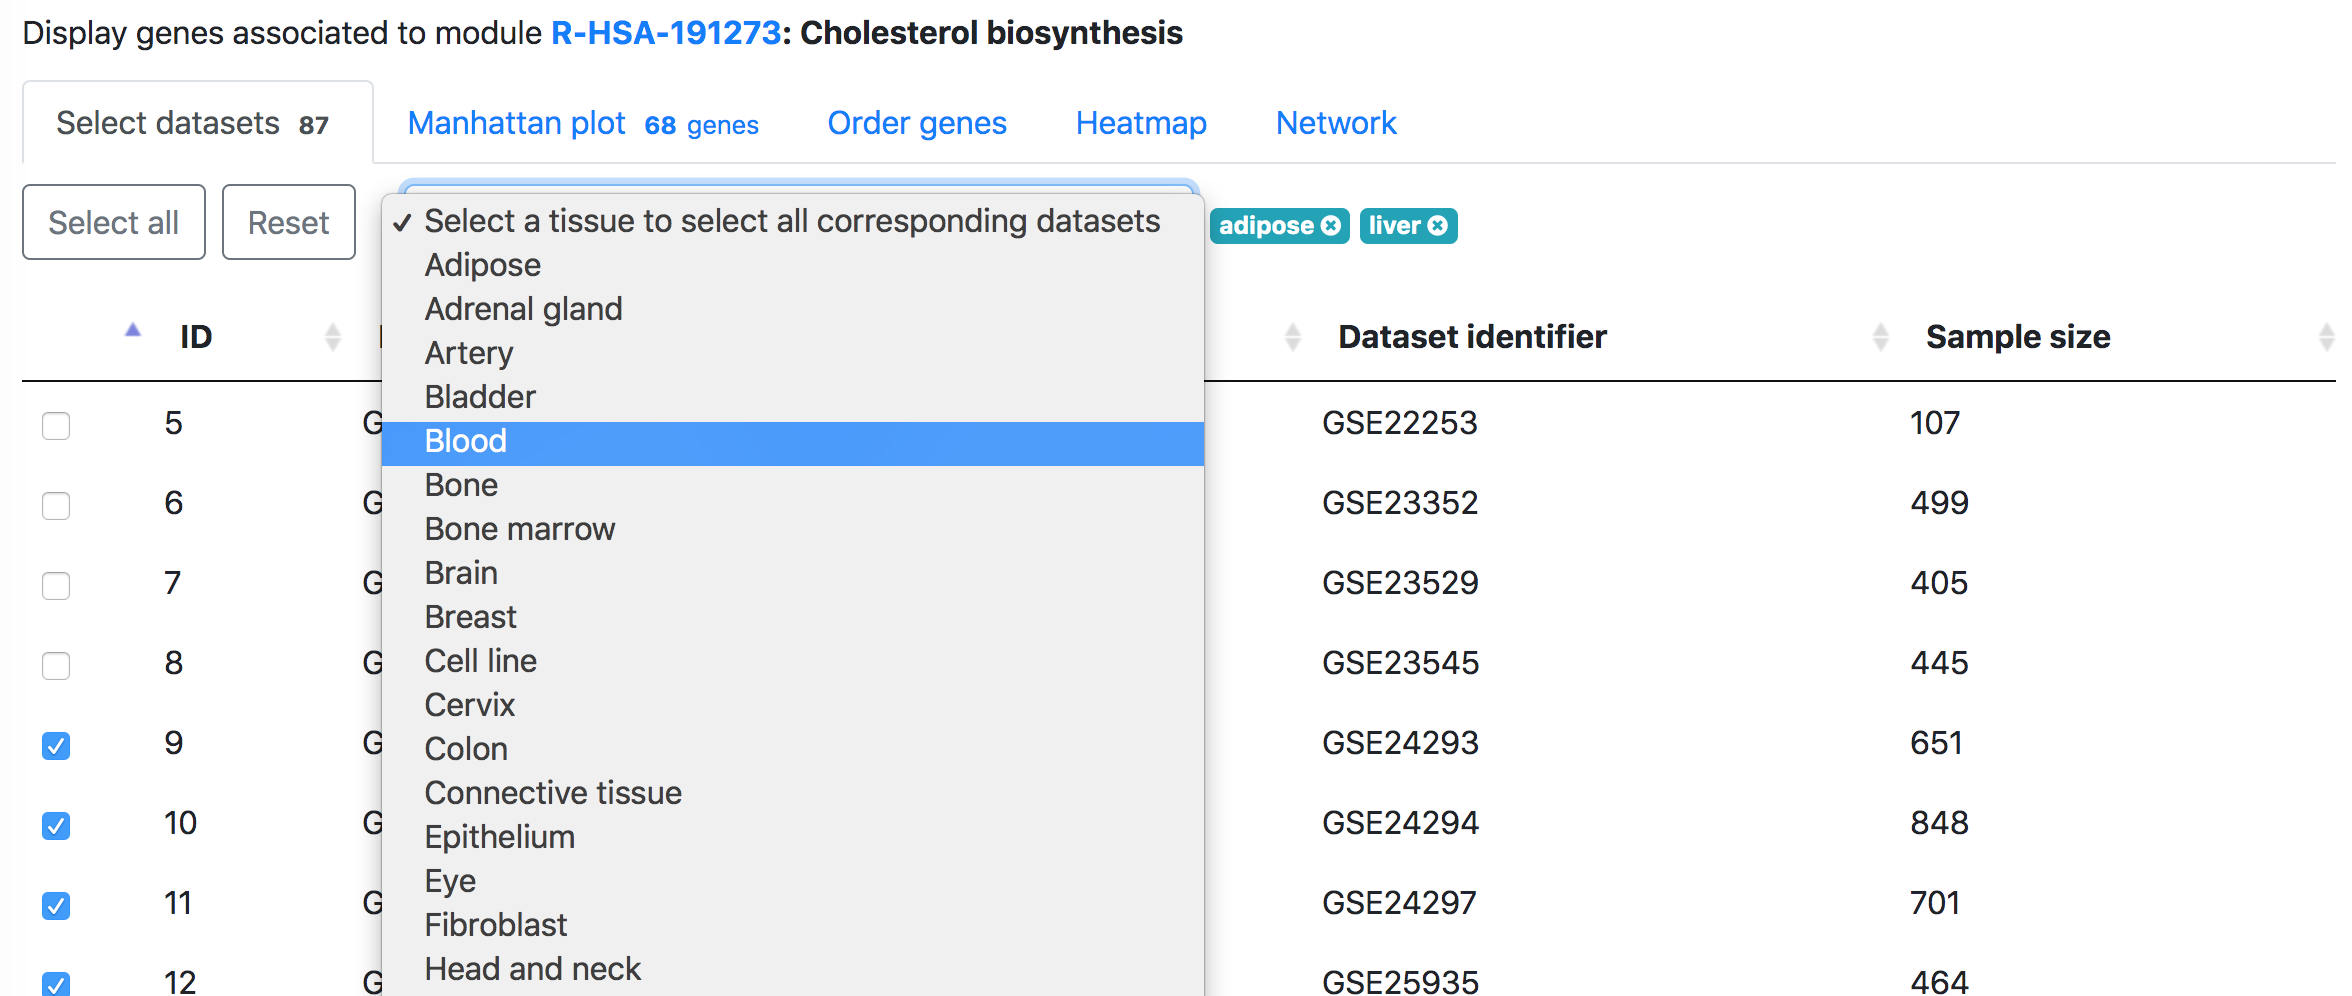
In the "Select datasets" tab appearing below, one can select the datasets used for the analysis based on the tissues of interest or simply skip this step to use all datasets. Selected tissues will appear to the right of the selection box. One can click "X" to delete one selected tissue or click "Reset" button to delete all selected tissues. The number in the tab name next to "Select datasets" indicates the number of selected datasets.
Then in the "Manhattan plot" tab, you can get the Manhattan plot for the analysis using the target module and selected datasets. The y-axis indicates the association scores between the genes and the target module, while the genes are arranged based on their genetic positions across chromosomes in the x-axis. Hove over the dots to see the details of the genes (gene symbol, genetic position, and association score). One can download the data and R code to reproduce the plot in local computer or download the exist figure in the svg format.
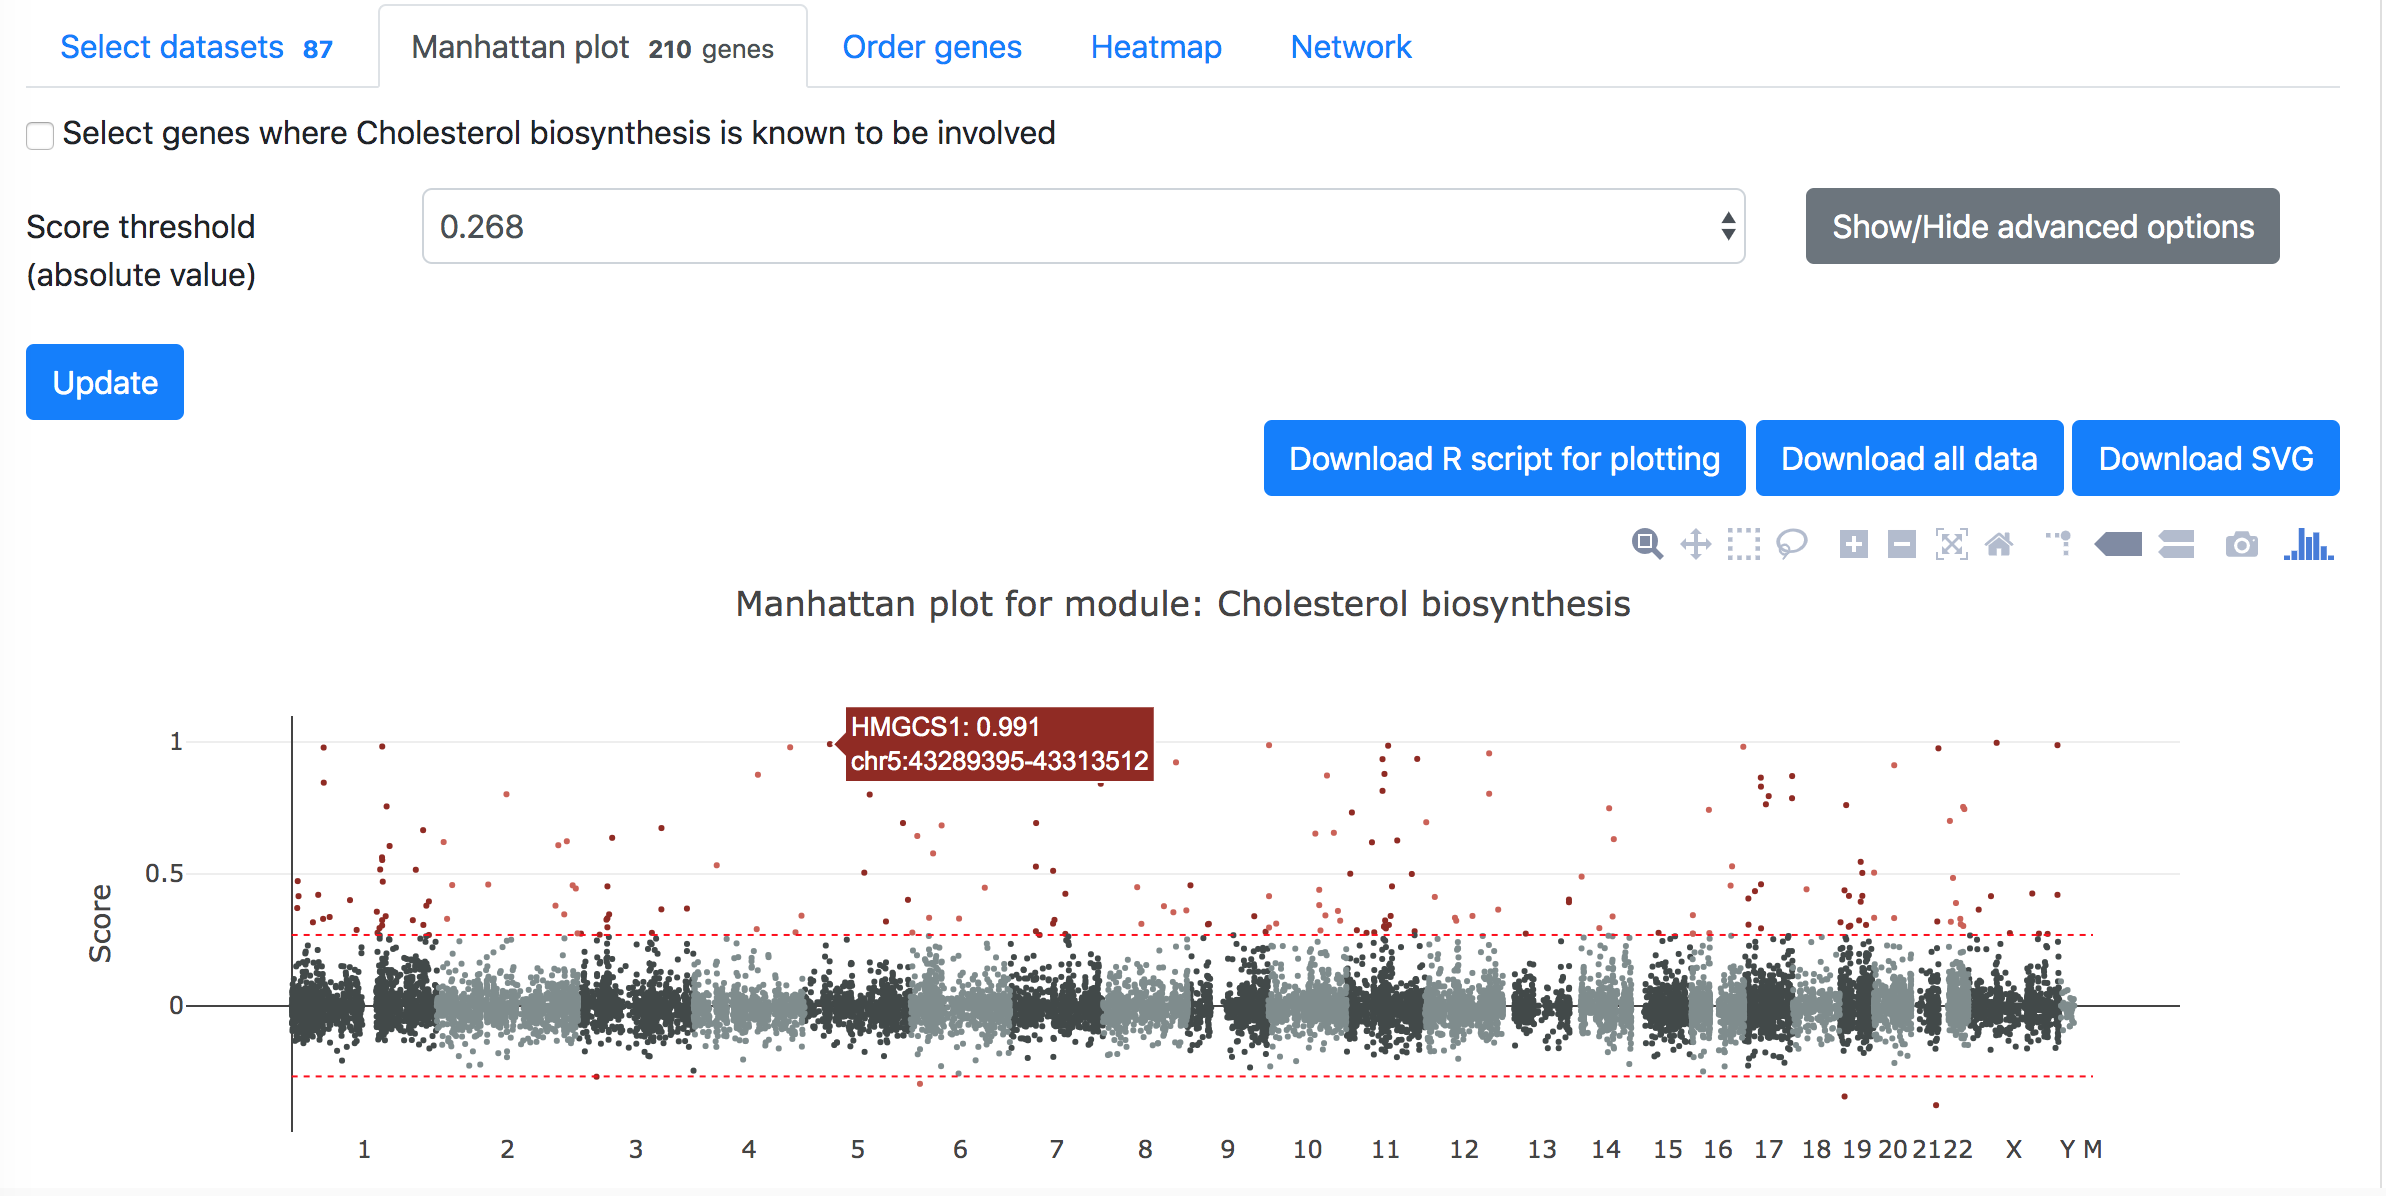
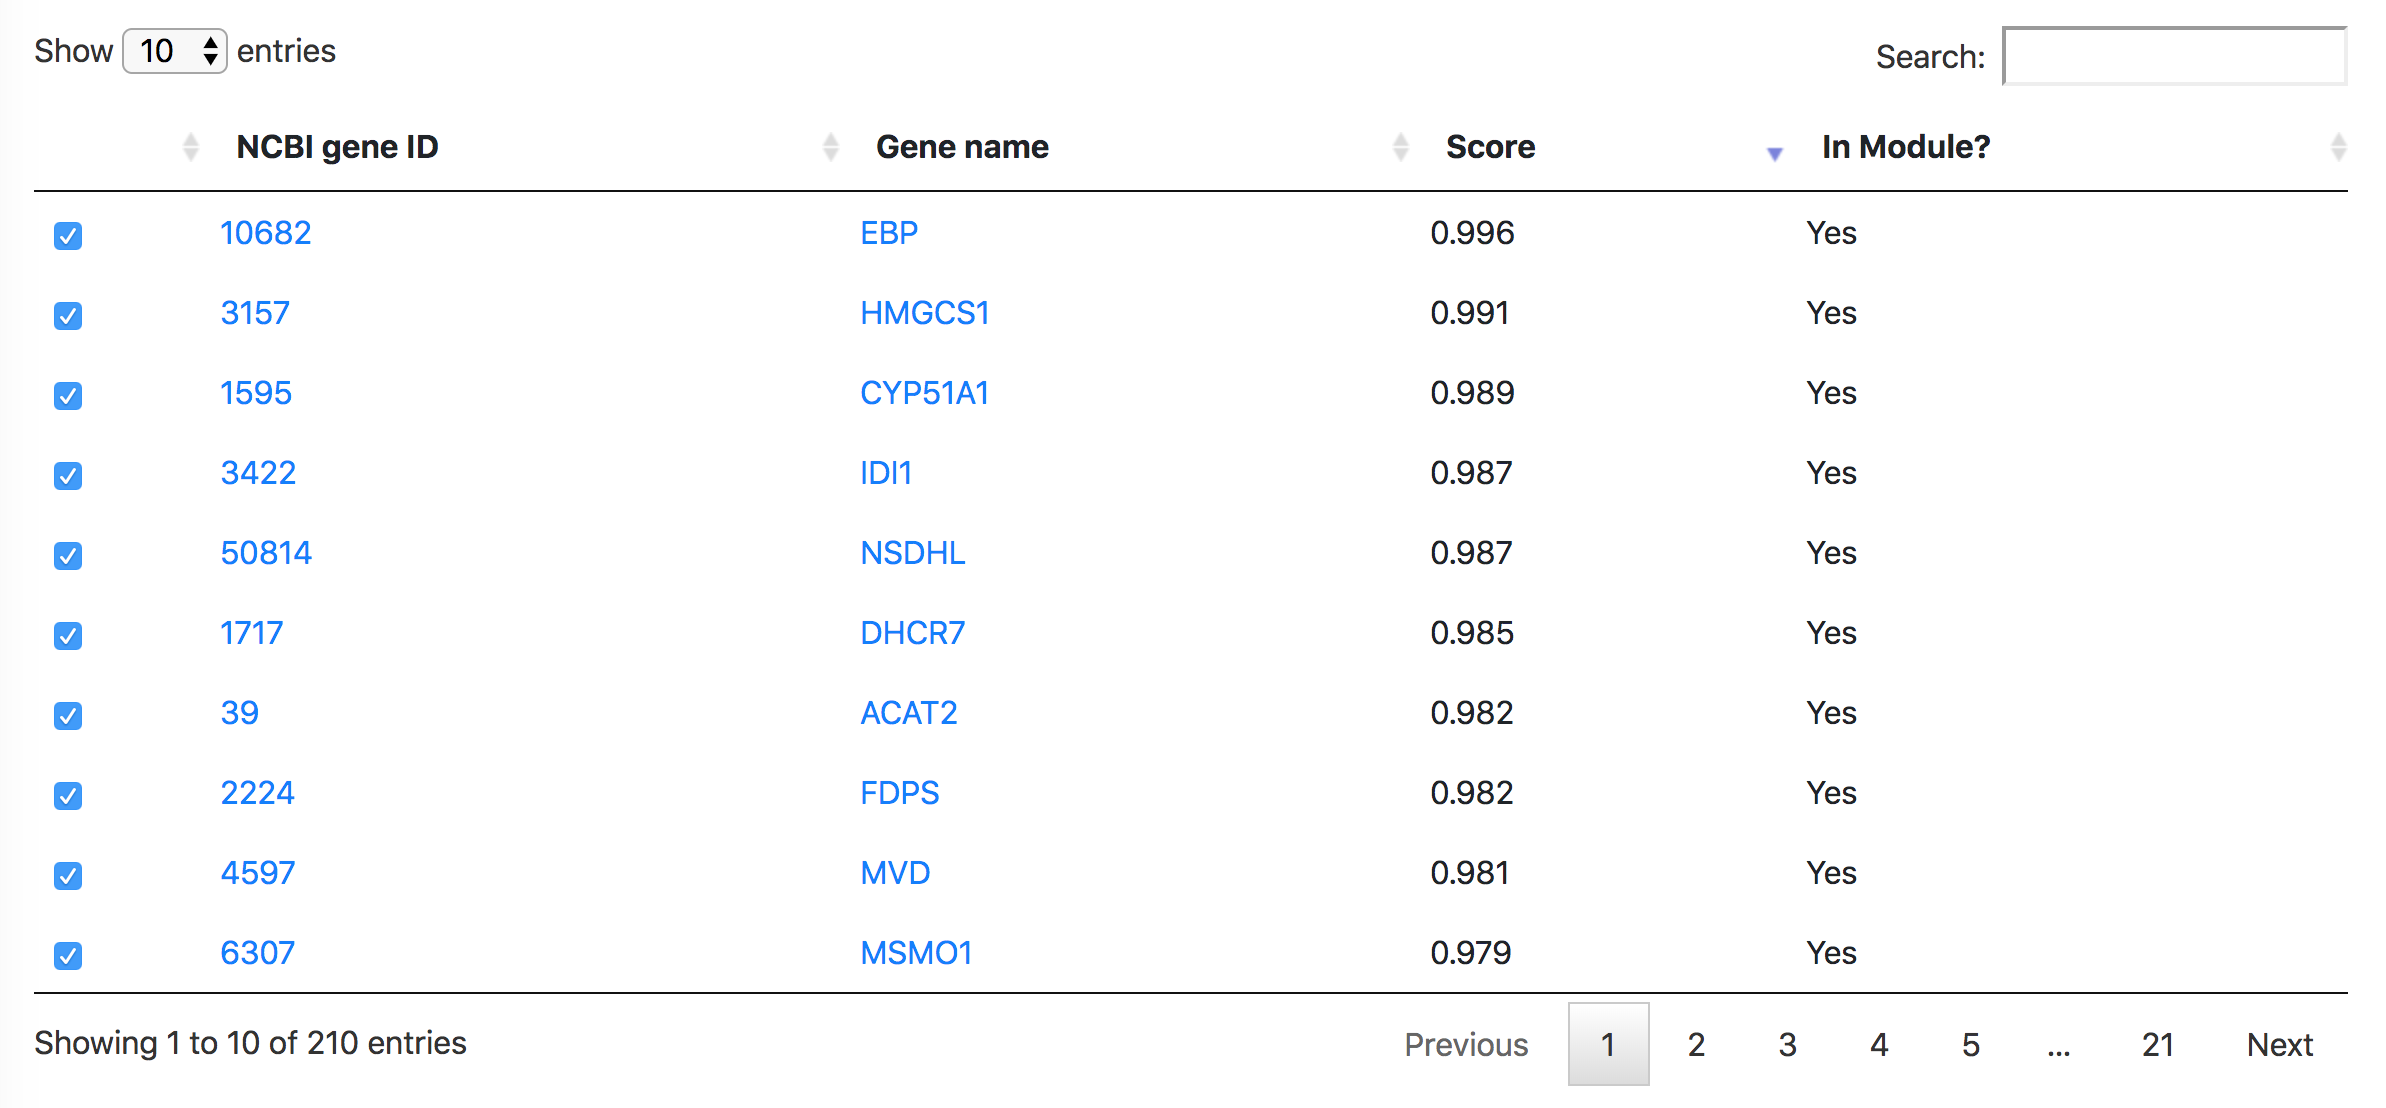
Below the Manhattan plot is a table listing the list of genes with association score exceeding the threshold.
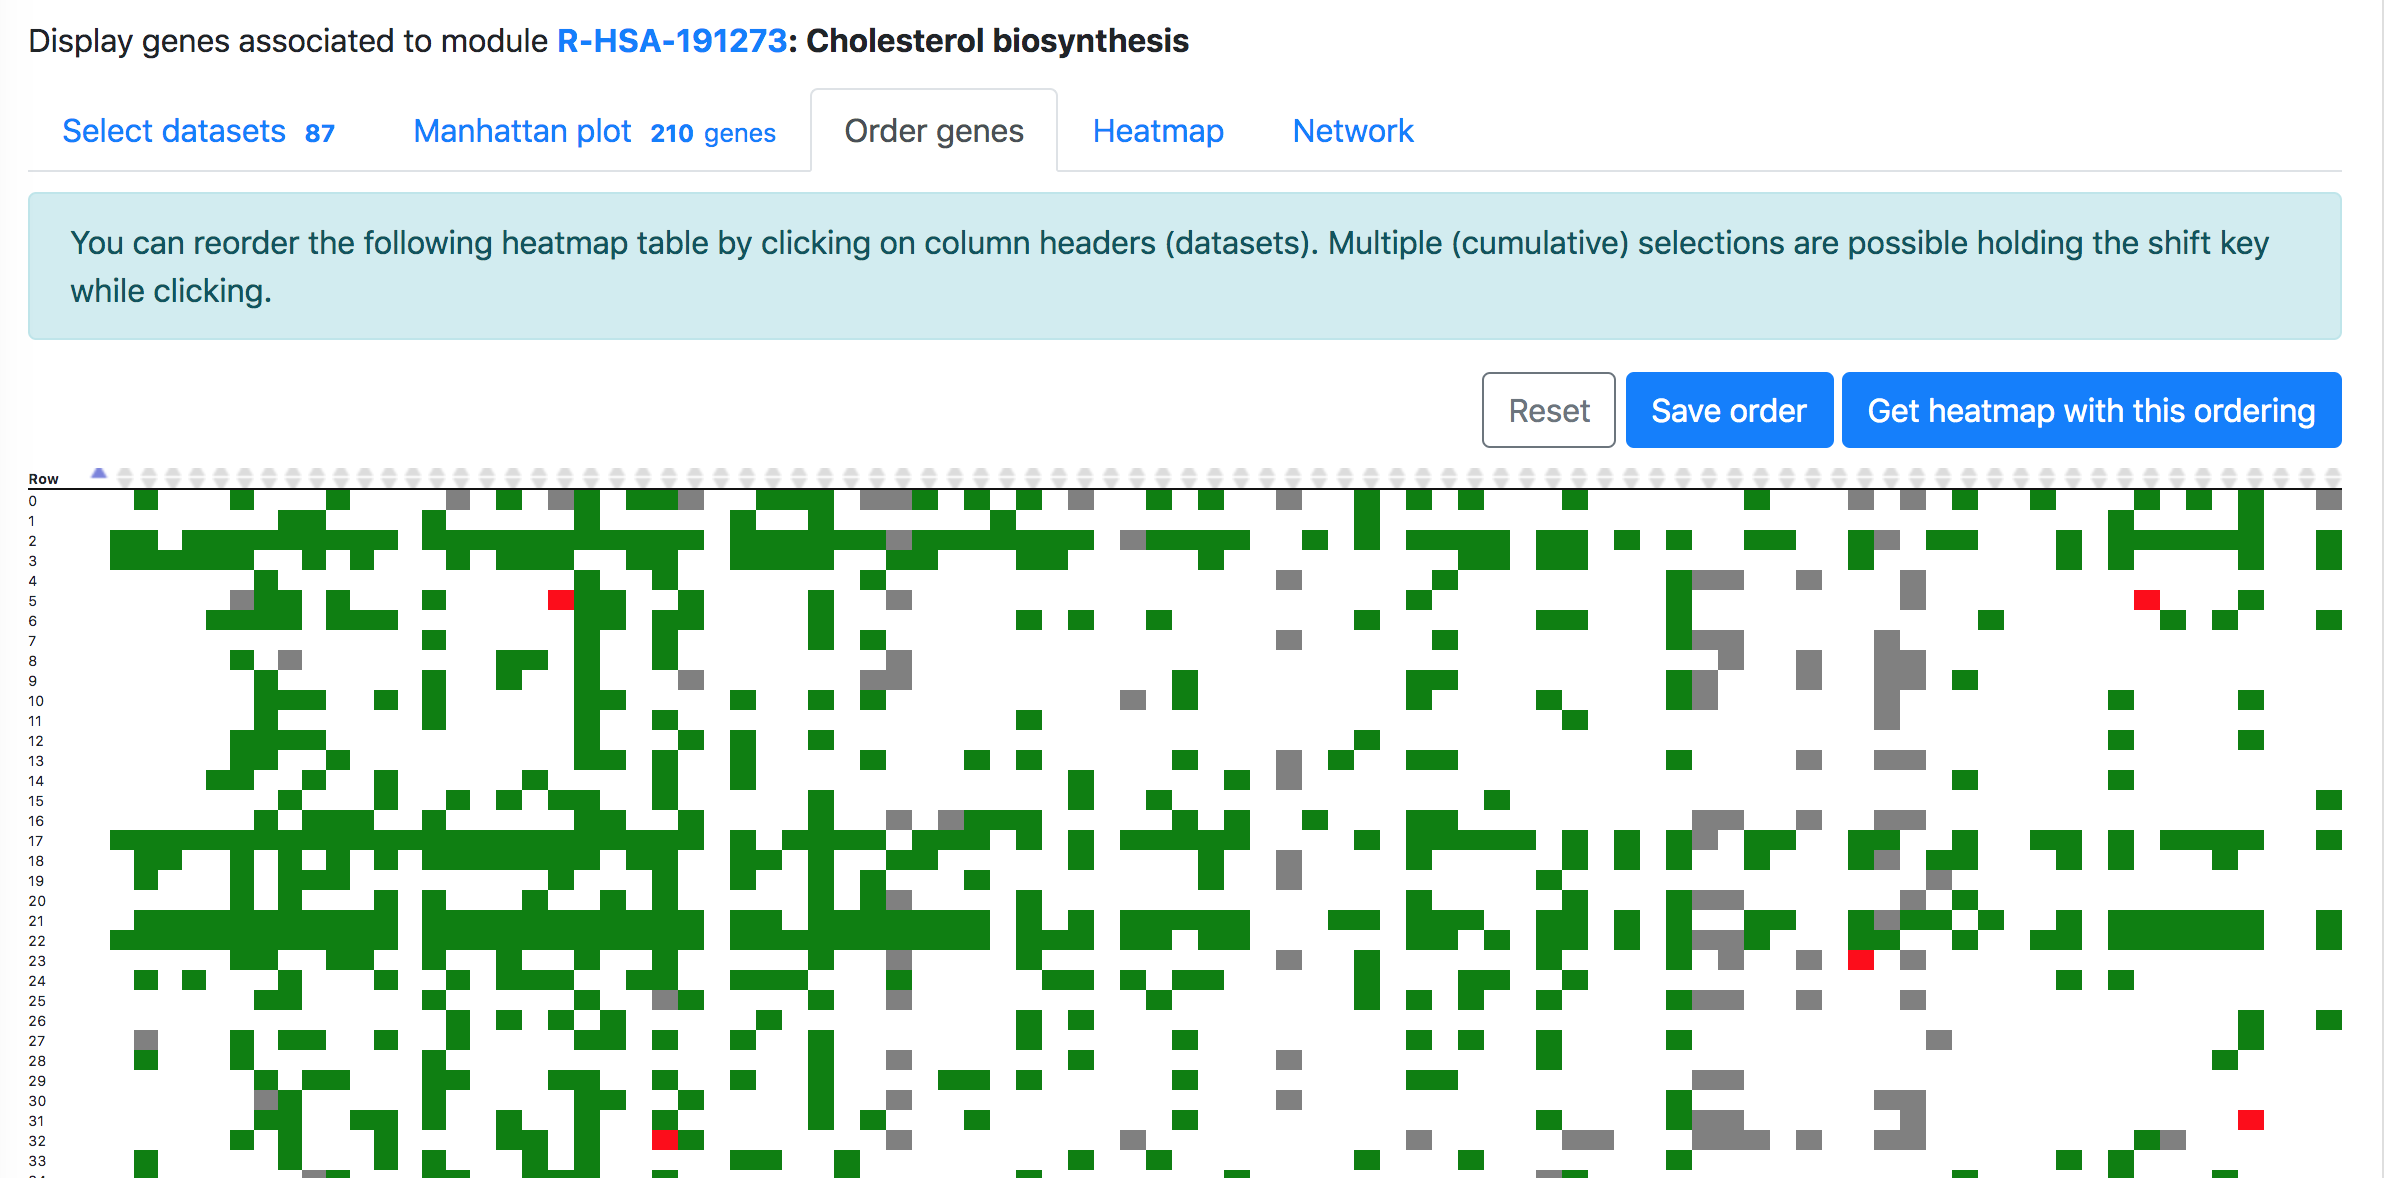
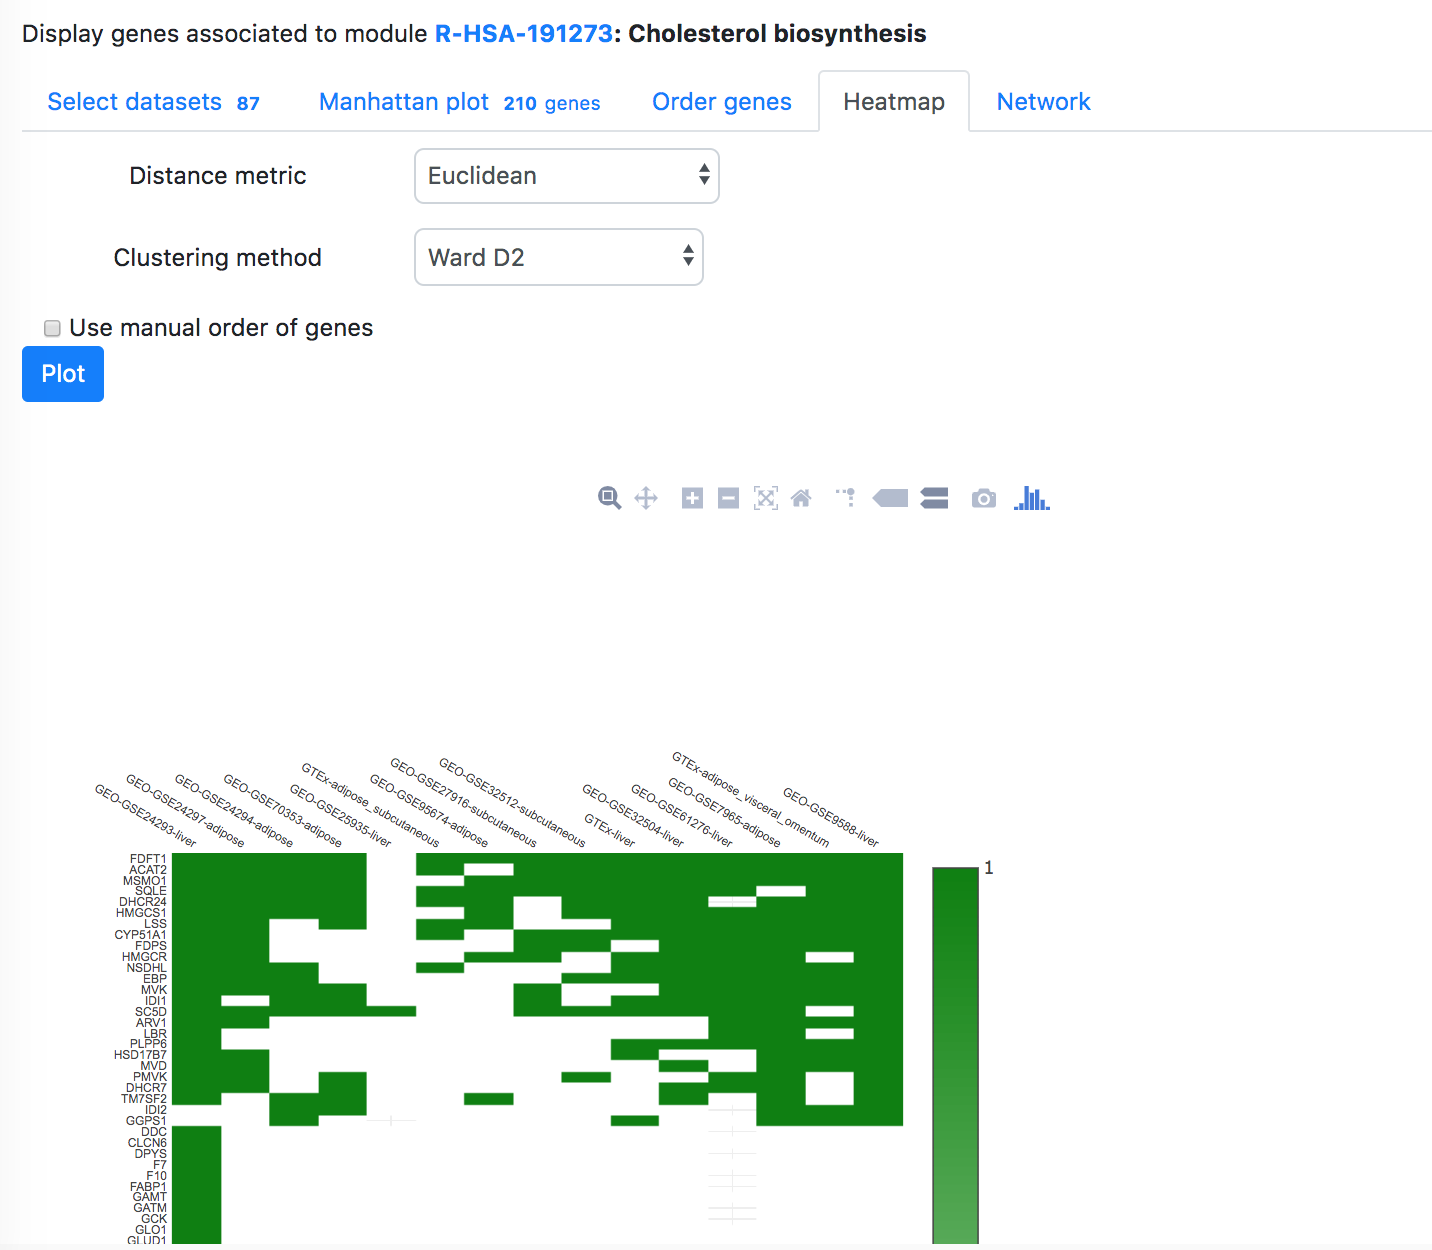
In the "Order modules" and "Heatmap" tabs, one can create a heatmap showing the results from all the selected datasets and genes. Please restrict the number of datasets and genes to less than 300, otherwise "Order genes" will not be possible, but you can download the heatmap from the "Heatmap" tab.
M-MAD - Modules by Module
"M-MAD - Modules by Module" identifies the associated modules (gene sets) for a given module.To perform the analysis, select "GeneBridge" under the "Explore" option. Go to the "M-MAD - Modules by Module" tab, and then select the species you want to use. Enter the module name or ID in the "Module name or identifier" box, then select the correct module from the dropdown list and click "Go" button to start the analysis.
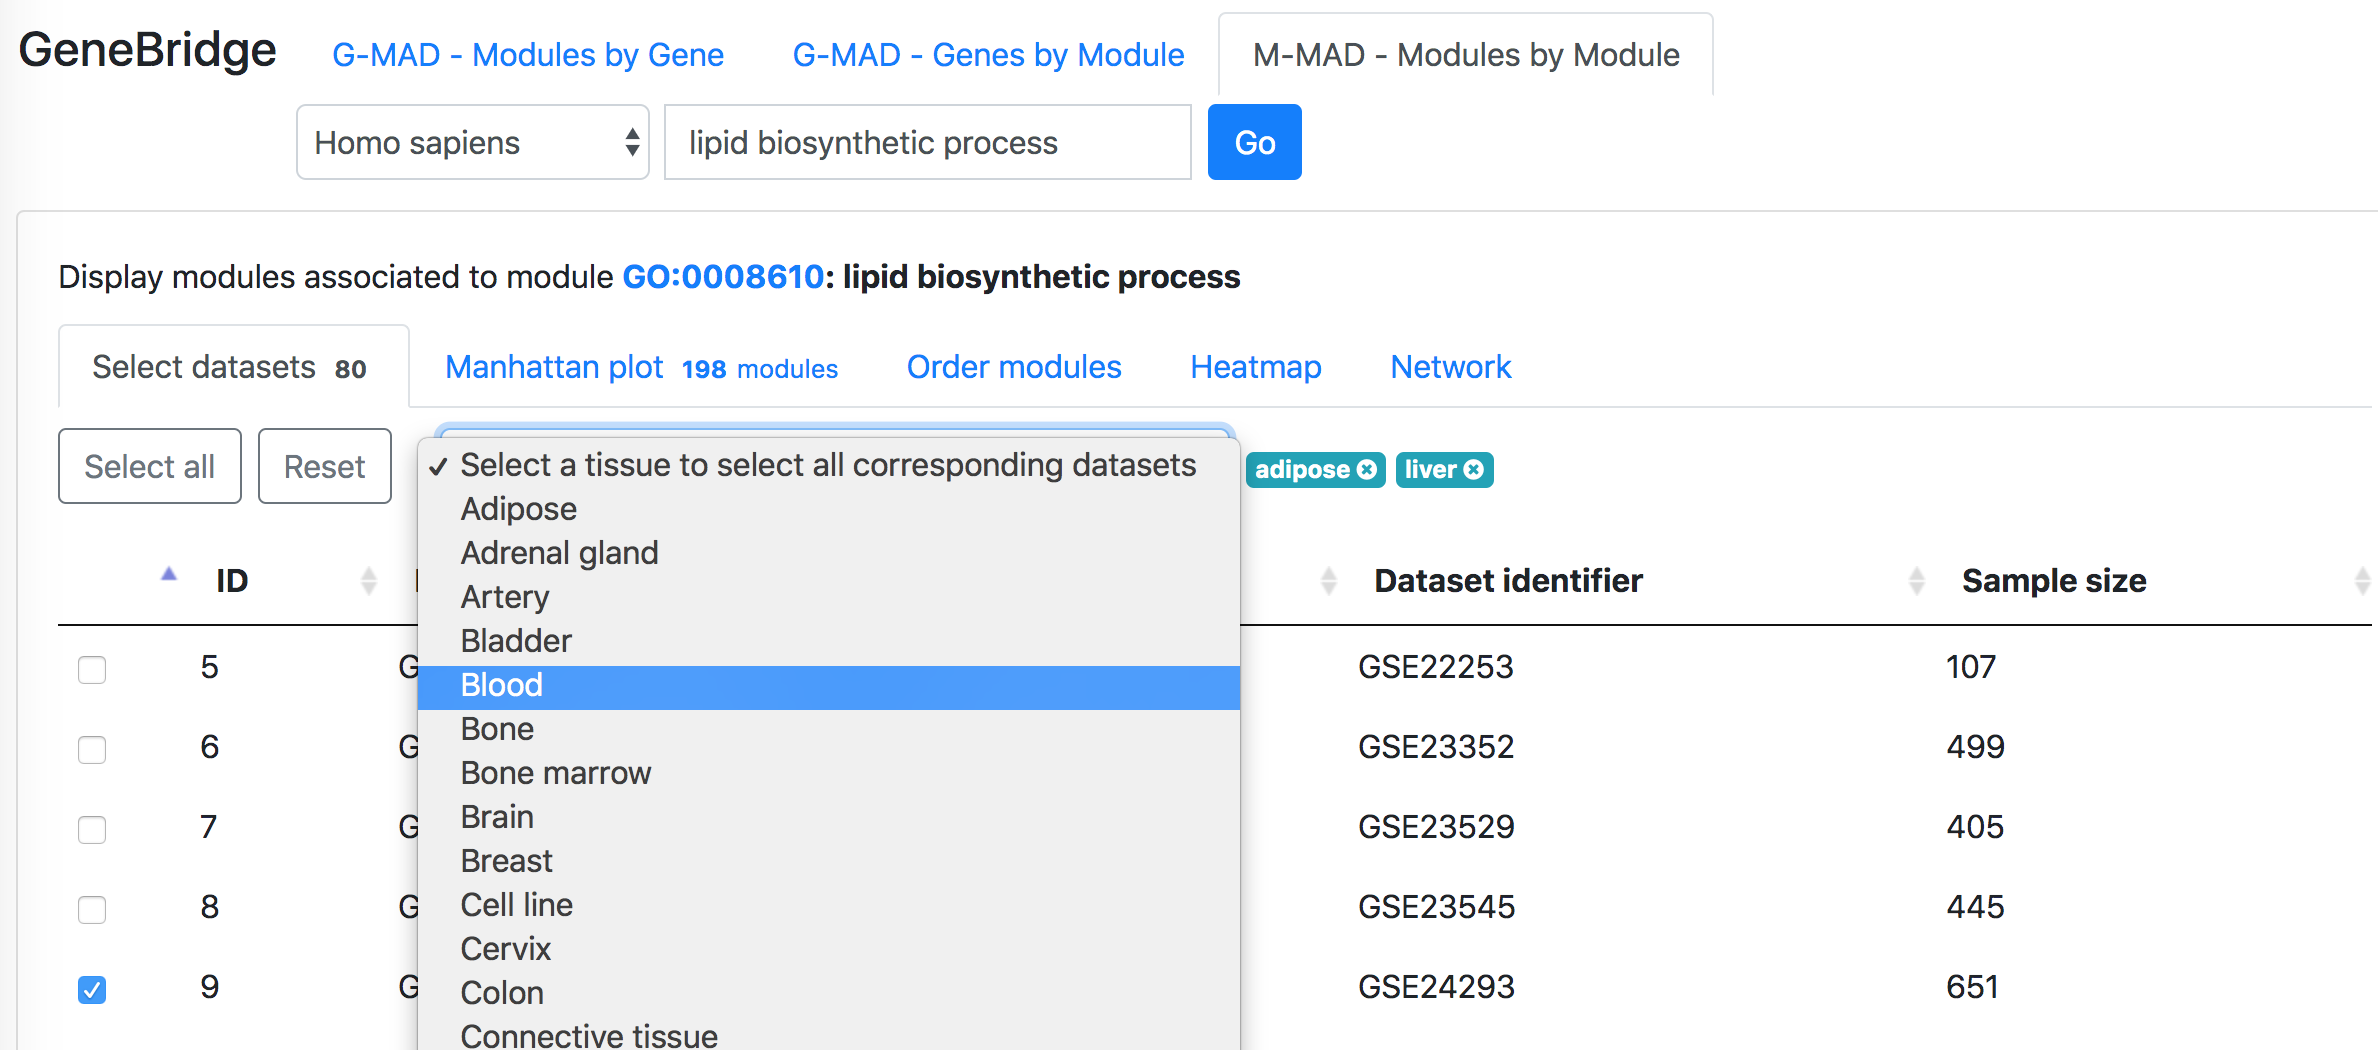
In the "Select datasets" tab appearing below, one can select the datasets used for the analysis based on the tissues of interest or simply skip this step to use all datasets. Selected tissues will appear to the right of the selection box. One can click "X" to delete one selected tissue or click "Reset" button to delete all selected tissues. The number in the tab name next to "Select datasets" indicates the number of selected datasets.
Then in the "Manhattan plot" tab, you can get the Manhattan plot for the analysis using the target module and selected datasets. The y-axis indicates the association scores between the modules and the target module, while the modules are arranged based on their similarities in gene compositions in the x-axis. Hove over the dots to see the details of the modules (ID, description, and association score). One can download the data and R code to reproduce the plot in local computer or download the exist figure in the svg format.
Below the Manhattan plot is a table listing the list of genes with association score exceeding the threshold.
In the "Order modules" and "Heatmap" tabs, one can create a heatmap showing the results from all the selected datasets and modules. Please restrict the number of datasets and modules to less than 300, otherwise "Order modules" will not be possible, but you can download the heatmap from the "Heatmap" tab.